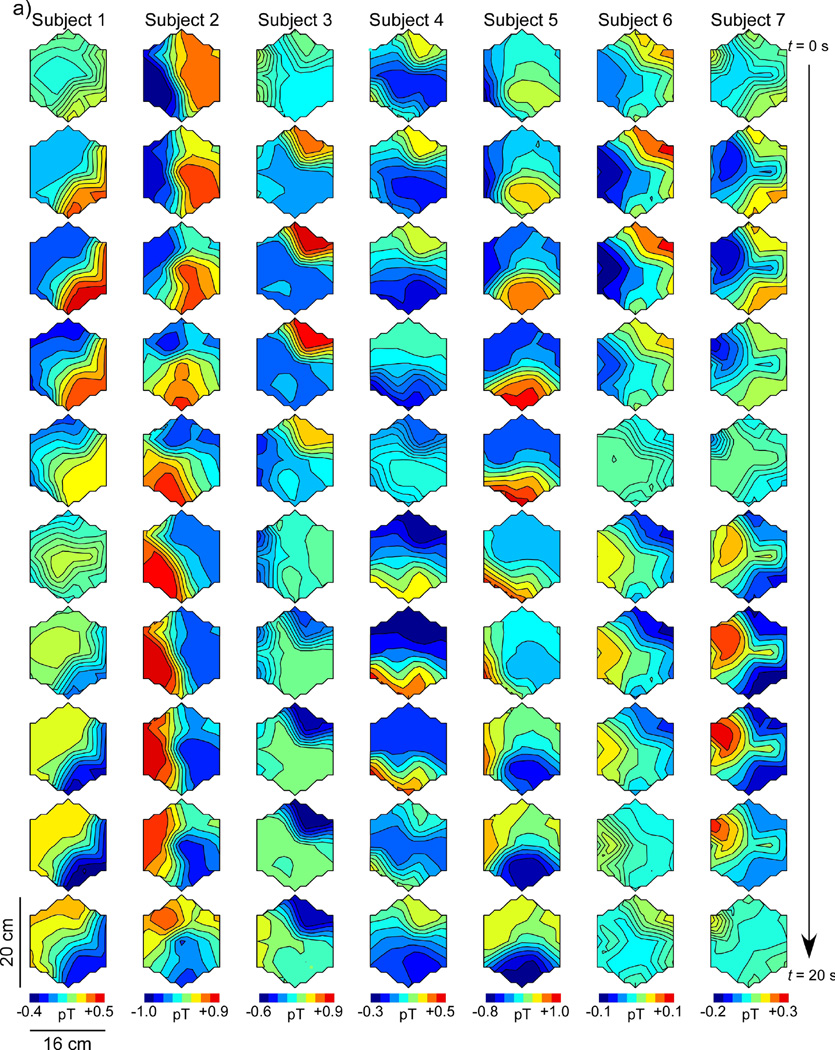
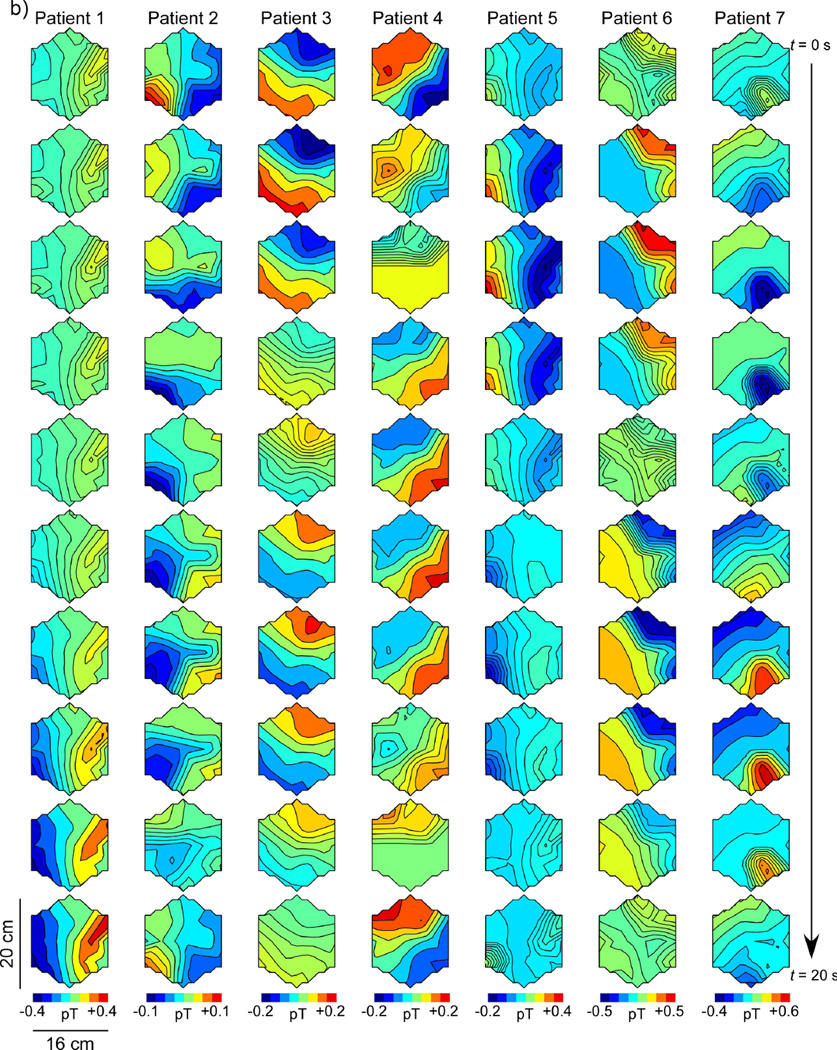
Figure 6.
Spatiotemporal SOBI-MGG maps from (a) normal control subjects and (b) gastroparesis patients in postprandial periods. Each column shows 10 maps of magnetic field activity at two-second intervals in a single subject. Isocontour lines correspond to magnetic field values reconstructed using SOBI. In healthy controls (a), the magnetic field generally progresses from the subject’s left-to-right across the sensor array, consistent with the known gastric slow wave propagation. By contrast, SOBI-MGG propagation maps from patients (b) were characterized by static or retrograde patterns. Maxima of SOBI-MGG maps were tracked to determine propagation velocities.


