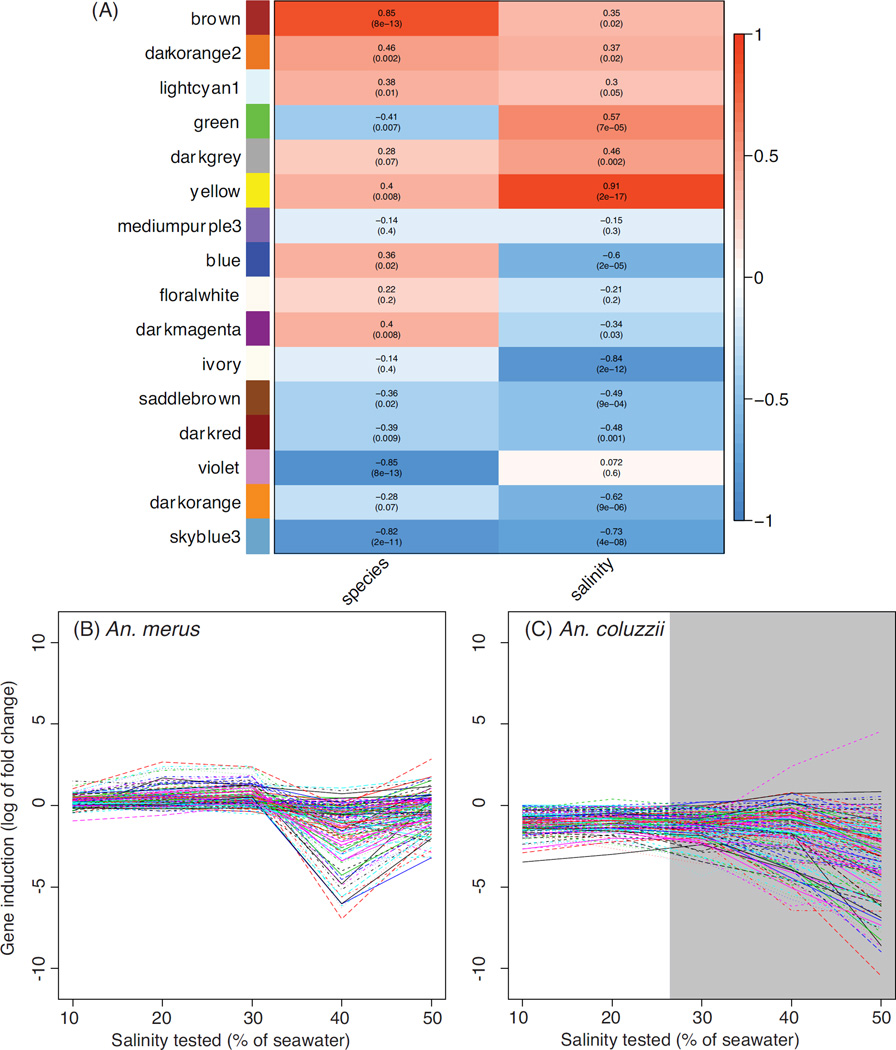
Figure 5.
Weighted gene co-expression networks for An. merus and An. coluzzii. Panel (A) shows correlations between each module (rows, named by color) and the traits of species identity (left column) and salinity (right column). Heatmap colors in the left column are red for higher expression in An. merus, and blue for higher expression in An. coluzzii. In the right column, red represents increasing expression as salinity increases, while blue depicts an inverse correlation for the module with salinity. Log2 fold change in SW relative to FW for genes in the darkred module are shown for An. merus (B) and An. coluzzii (C). Lethal salinities for An. coluzzii are shaded gray.

