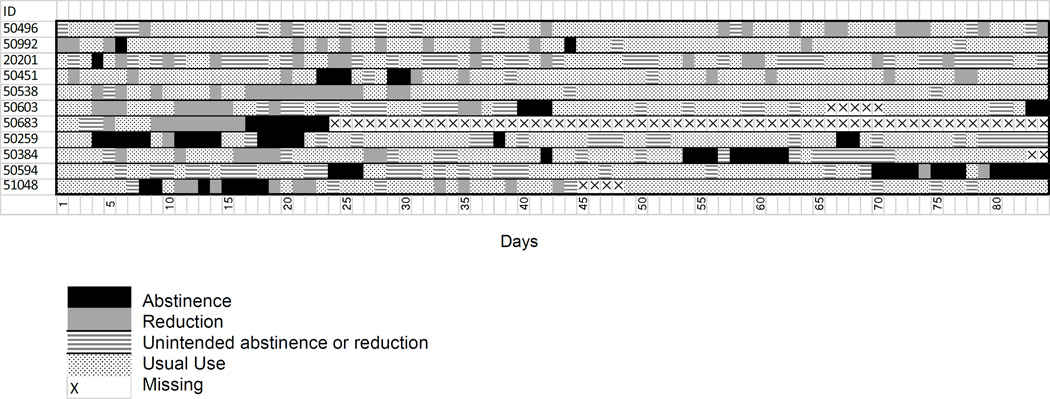
Figure 2.
Use status of “average” participants; i.e., the 11 participants nearest the median number of days of abstinence or reduction for the entire sample. Black = day of intentional abstinence (i.e., quit attempt), gray = day of intentional reduction, dotted = day of usual use (including unintentional abstinence or reduction), X = day with missing data.

