Figure 1.


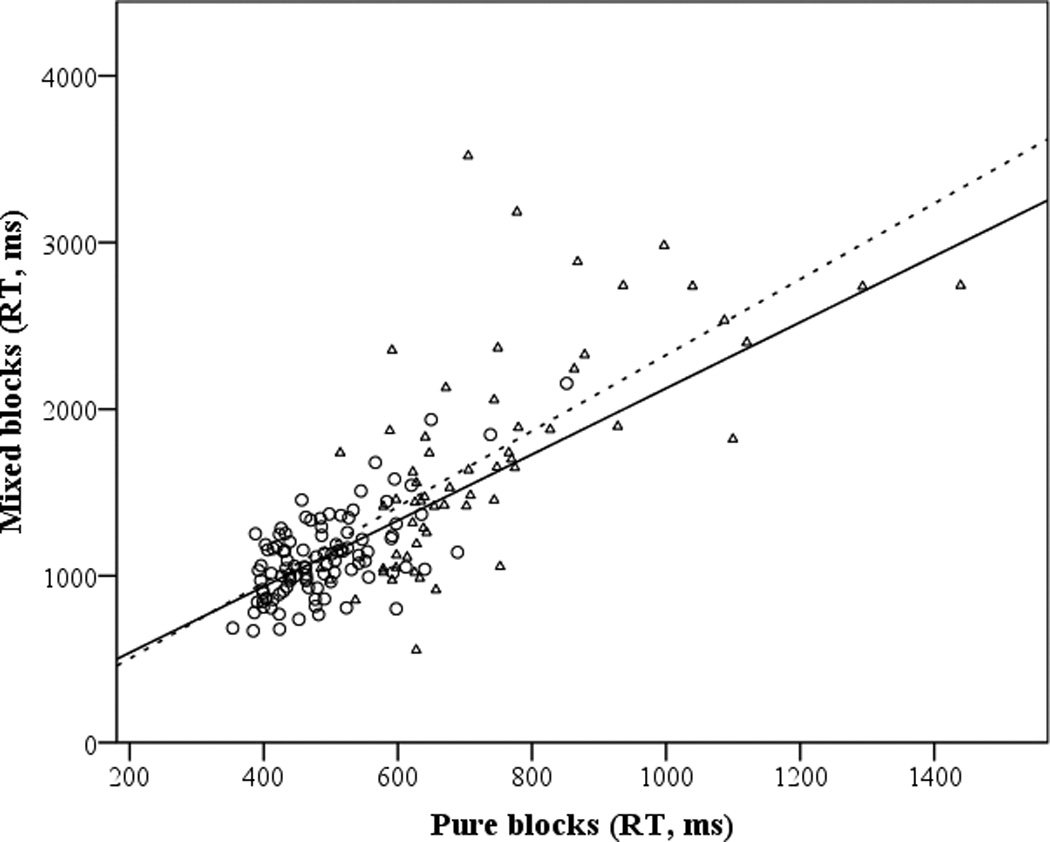
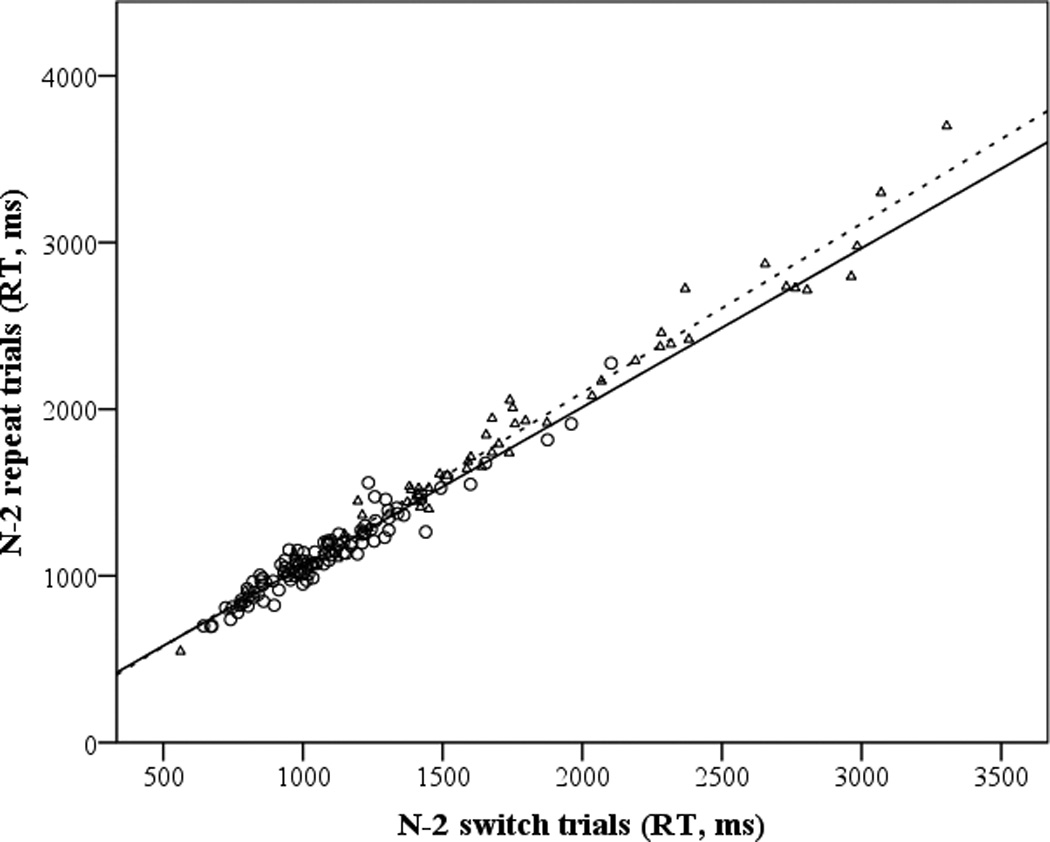
Scatterplots and fit lines for the global (1a) and N-2 (1b) shifting response times, by condition and age group. Young adults are indicated by circles (solid line) and older adults by triangles (dashed line).


Scatterplots and fit lines for the global (1a) and N-2 (1b) shifting response times, by condition and age group. Young adults are indicated by circles (solid line) and older adults by triangles (dashed line).