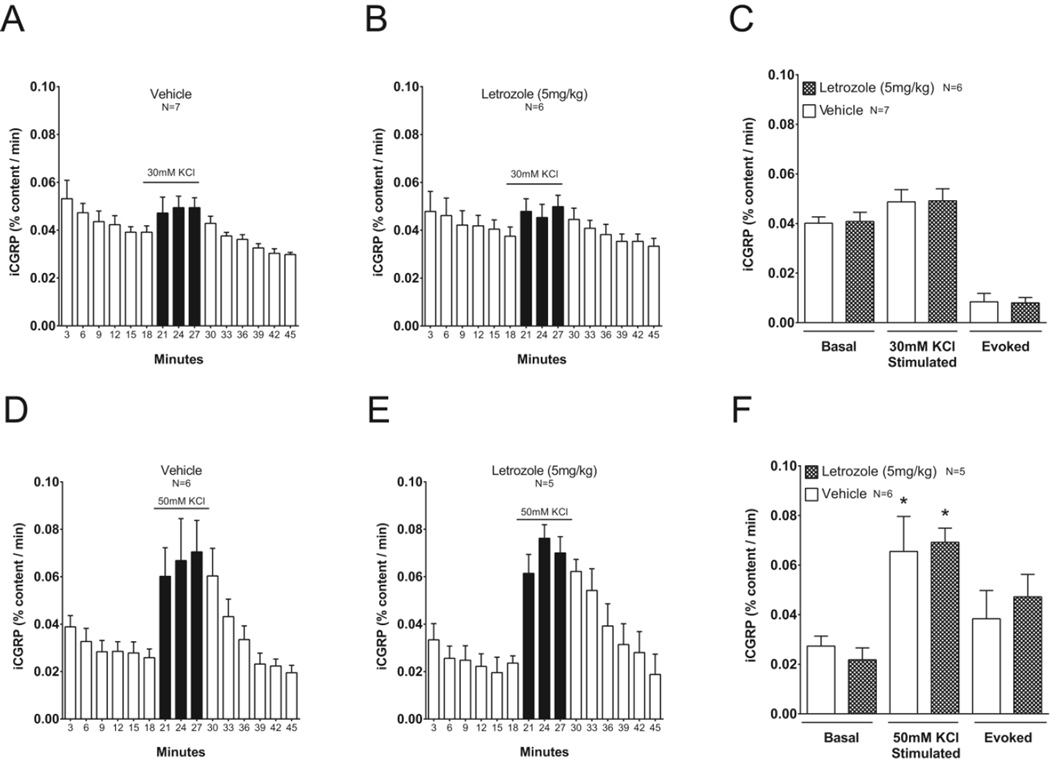
Figure 6. Release of iCGRP is not altered in spinal cord slices from male rats with letrozole-induced mechanical hypersensitivity.
A, B, D and E: Basal and potassium-stimulated release of iCGRP was measured from spinal cord slices isolated from rats following treatment with vehicle (A, D) or 5 mg/kg letrozole (B, E) for 7–8 days. Open columns represent iCGRP released from spinal cord slices perfused with HEPES buffer alone for successive 3-minute intervals, whereas black columns represent iCGRP released when tissues were perfused with HEPES buffer containing 30 mM (A, B) or 50mM potassium (D, E). The ordinate represents the mean ± S.E.M. of iCGRP released per minute, expressed as the percent of total iCGRP content in the spinal cord slice. C and F: Summary of mean ± S.E.M. of iCGRP release as percent of total content/min during basal (minutes 9–18) and high potassium stimulation (minutes 18–27) in vehicle or letrozole-treated rats from (A - E). Evoked release is calculated as stimulated release minus basal release. Asterisks indicate significant differences in iCGRP release between stimulated and basal conditions using two-sample t-tests.

