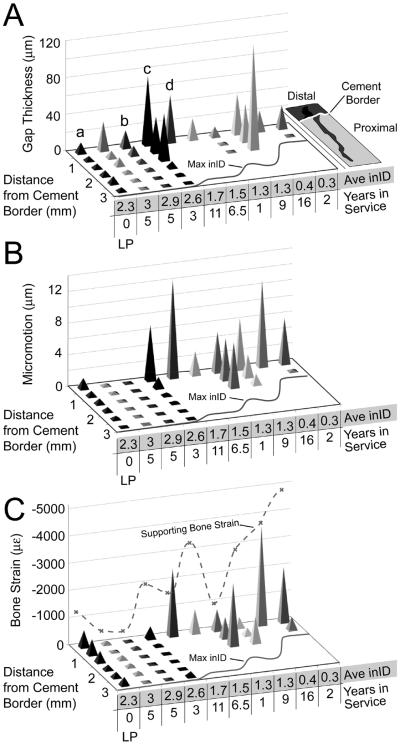
Figure 3.
Median trabeculae-cement gap (A), micromotion (B), and trabecular bone strain (C) as a function of distance from the cement border for the 9 postmortem retrieval specimens and the average of the 9 laboratory prepared (LP) specimens. The average initial interidigitation (inID) and years in service are shown. The maximum initial interdigitation (Max inID) is shown graphically along the base of the plots and the supporting bone strain is shown as a dashed line along the vertical axis. Data are divided into 0.5 mm bins for each specimen. The lower case a, b, c, d indicated in panel A correspond to panels A-D in Figure 2.

