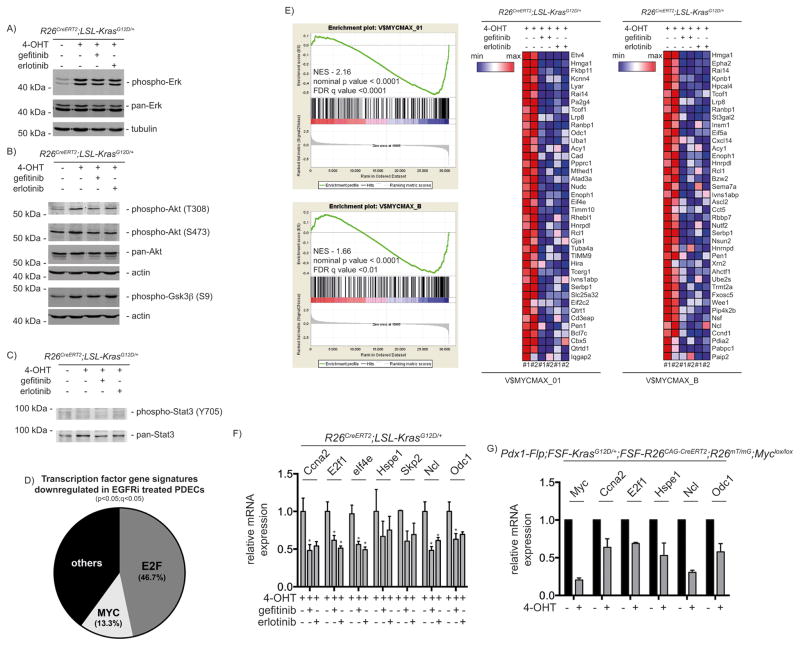
Figure 3. MYC is a downstream effector of EGFR.
PDECs were treated for 6 days with 4-OHT (500 nM) and gefitinib or erlotinib (10 μM each) were added for the last 24 hours as indicated. Western blot of A) phospho- and pan-ERK (α-tubulin: loading controls). B) phospho-AKT (#9271 and #9275, Cell Signaling Technology) and -GSK3β (#9323, Cell Signaling Technology) as well as pan-AKT ((C67E7), #4691, Cell Signaling Technology). Different lysates were blotted to different membranes and loading was controlled by β-actin. C) phospho-STAT3 ((D3A7), #9145, Cell Signaling Technology) and pan-STAT3 ((C-20):sc-482, Santa Cruz Biotechnology) western blot. D) Transcription factor gene signatures (TFT-MSigDB) significantly downregulated in EGFR inhibitor (EGFRi) treated PDECs. PDECs were treated as described in A). E) GSEA enrichment plots of MYC signatures and corresponding heatmaps (top 40 MYC controlled genes inhibited by the EGFR inhibitors) from microarrays of PDECs treated as described in A). NES: normalized enrichment score; FDR: false discovery rate. EMBL-EBI ArrayExpress Accession number: E-MTAB-2592. See supplementary material and methods for a description of the microarray analysis and gene set enrichment analysis. F) PDECs were treated as described in A). Relative Ccna2, E2F1, eIf4e, Hspe1, Skp2, Ncl, and Odc1 mRNA expression levels were determined by qPCR using beta-actin mRNA expression as reference. Primers are depicted in supplementary material and methods. One way ANOVA *p-value < 0.05. G) PDECs from 2 months old Pdx1-Flp;FSF-KrasG12D/+;FSF-R26CAG-CreERT2;R26mT/mG;MYClox/lox mice were isolated. In these cells expression of KrasG12D is induced in vivo and expression of floxed genes can be manipulated by the treatment of cells with 4-OHT. The cells were treated with 4-OHT (500 nM) for 24 hours. The green fluorescent protein (GFP)-expressing cells were FACS (fluorescence-activated cell sorting) sorted as recently described 50. Relative Myc, Ccna2, E2f1, Hspe1, Ncl, and Odc1 mRNA expression levels were determined by qPCR using beta-actin mRNA expression as reference and compared to untreated cells, in which expression was set to 1. The Pdx1-Flp, FSF-KrasG12D, and the FSF-R26CAG-Cre-ERT2 mouse lines were described recently in 25. The R26mT/mG mouse line is described in 51 and the MYClox line in 52.

