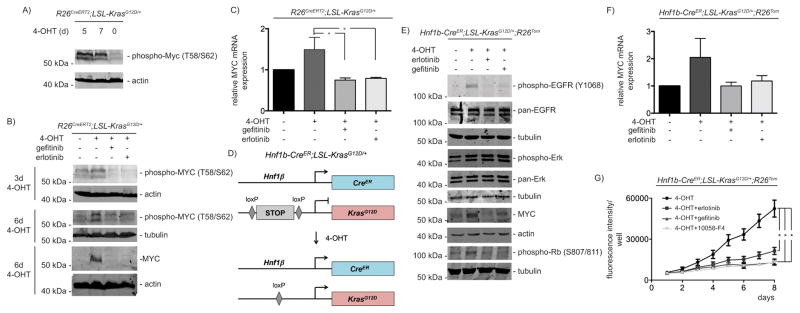
Figure 4. MYC expression is regulated by the autocrine EGFR-loop.
A) Indicated PDECs were treated with 4-OHT (500 nM) over time. Western blot for phospho-MYC (#9401, Cell Signaling Technology) (β-actin: loading control). B) PDECs were treated with 4-OHT (500 nM) as indicated. Gefitinib or erlotinib (10 μM each) were added for the last 24 hours of incubation. Westernblot for phospho-MYC and MYC (#9402, Cell Signaling Technology). Different lysates were blotted to different membranes and loading was controlled by β-actin or α-tubulin as indicated. To detect phosphorylated MYC, PDECs were lysed by directly boiling in protein loading buffer. C) Indicated PDECs were treated with 4-OHT (500 nM) for 6 days. Gefitinib or erlotinib (10 μM each) were added for the last 24 hours of incubation. Relative Myc mRNA expression levels were determined by qPCR using beta-actin mRNA expression as reference. One way ANOVA *p-value < 0.05. D) Genetic strategy to activate KrasG12D-expression in Hnf1β-positive PDECs (Hnf1b-CreER;LSL-KrasG12D/+;R26Tom). The Hnf1b-CreER mouse line was described in 30 and the R26Tom reporter mouse line in 53. E) PDECs from Hnf1b-CreER;LSL-KrasG12D/+;R26Tom mice were treated with 4-OHT (1 μM) for 15 days. Afterwards gefitinib or erlotinib (10 μM each) were added for additional 24 hours or the cells were left as vehicle treated controls. Western blot of phospho-EGFR, pan-EGFR, phospho-ERK and pan-ERK, MYC, and phospho-Rb. Different lysates were blotted to different membranes and loading was controlled by β-actin or α-tubulin as indicated. F) PDECs from Hnf1b-CreER;LSL-KrasG12D/+;R26Tom mice were treated with 4-OHT (1 μM) for 15 days. Afterwards gefitinib or erlotinib (10 μM each) were added for additional 24 hours. Relative Myc mRNA expression levels were determined by qPCR using beta-actin mRNA expression as reference. G) PDECs from Hnf1b-CreER;LSL-KrasG12D/+;R26Tom mice were treated with 4-OHT (1 μM) for 15 days. Afterwards, 2.000 cells per well were seeded in a 96 well plate in quadruplicates (n=4). After 24 hours the cells were treated with erlotinib (10 μM), gefitinib (10 μM), or 10058-F4 (80 μM) or were left as vehicle treated controls. To determine relative growth, fluorescence (excitation: 560 nm, emission 590 nm) was measured daily over 8 days with a BMG FLUOstar OPTIMA Microplate Reader (BMG Labtech, Ortenberg, Germany). One way ANOVA *p-value < 0.05.

