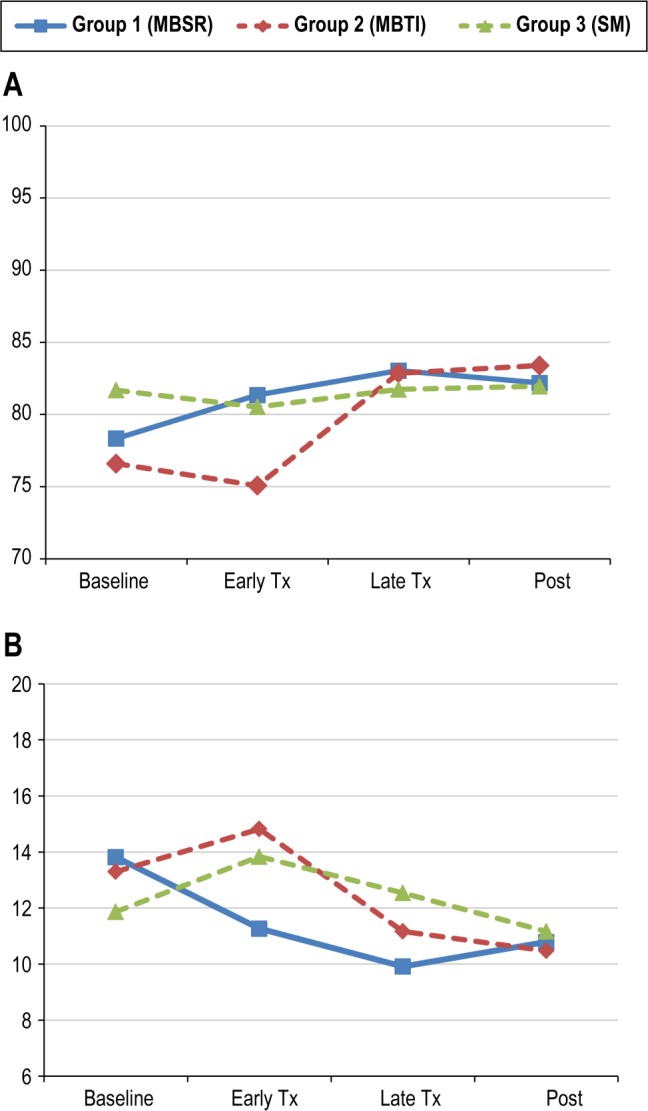
Figure 1. Sleep efficiency.

Model-based estimates of group means (A) and within-subject standard deviations (B) for sleep efficiency across the 4 time periods. Note that the location-scale mixed model compares the change from baseline as opposed to the values at each time point. (B) Significant interactions can be seen as the differential change in within-subject standard deviations from baseline to early treatment between MBSR vs SM and MBSR vs MBTI and from baseline to late treatment between MBSR vs SM.
