Fig. 4.

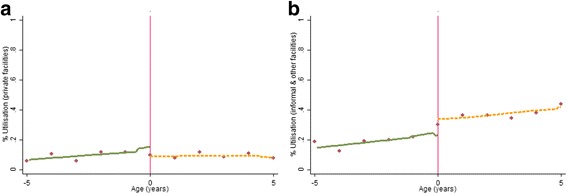
Non-parametric regression plots showing utilisation of health care services below and above the eligibility threshold, in: a Private formal health facilities b Informal/other health facilities

Non-parametric regression plots showing utilisation of health care services below and above the eligibility threshold, in: a Private formal health facilities b Informal/other health facilities