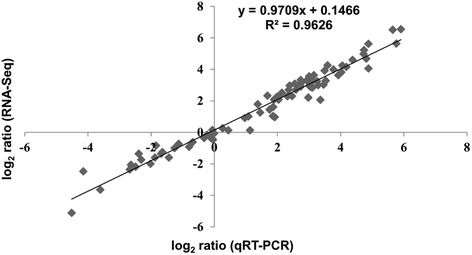
Fig. 2.

Validation of the expression of selected genes from RNA-Seq using qRT-PCR. Fold changes in gene expression were transformed to a log2 scale. The qRT-PCR data log2-values (X-axis) were plotted against the RNA-Seq log2 values (Y-axis). The function of the regression line and the R2 value are shown
