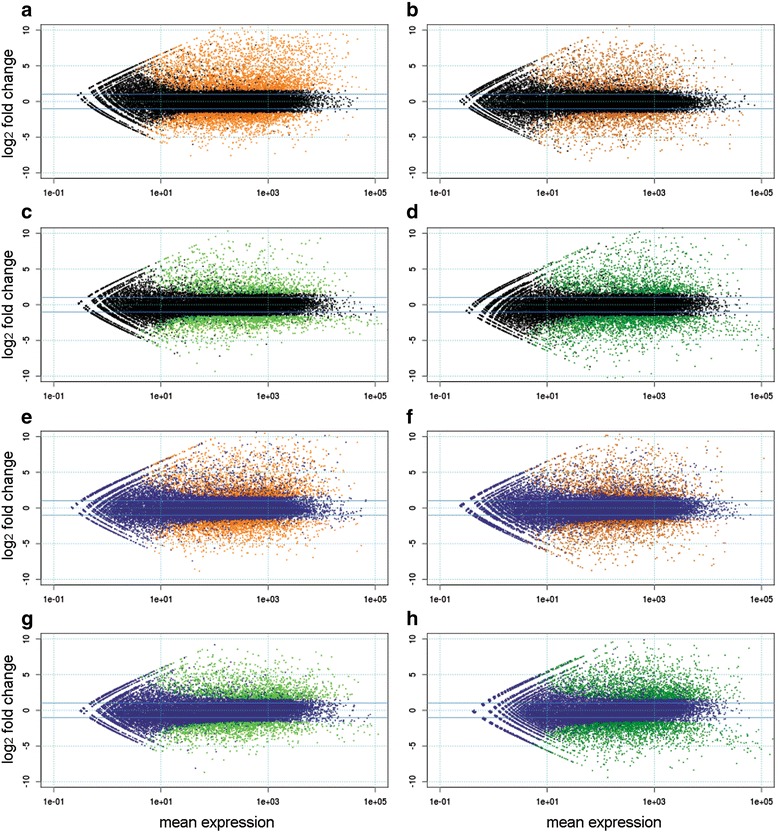
Fig. 4.

Mean expression vs. log fold change plots (MA-plots) of Eurosis and Loto samples. Mean expression vs. log fold change plots (MA-plots) were computed for Eurosis (plotted in black; a-d) and Loto (plotted in blue; e-h) contrasts. Normalised expression mean values are plotted vs. log2fold changes. Called DEGs (FDR < 0.001 and fold change > 3) are plotted in orange for root samples (a, b, e and f) and in green for leaf samples (c, d, g and h)
