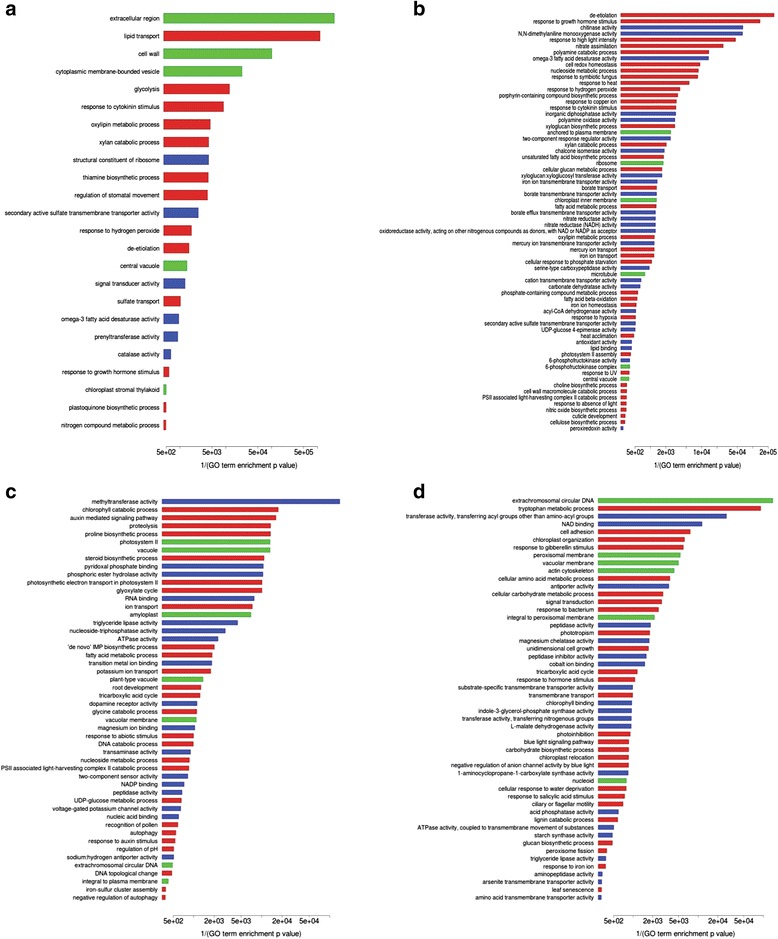
Fig. 6.

Barplots of differentially enriched GO terms in the leaves. Barplots of differentially enriched GO terms (from one genotype/organ/treatment missing in the alternative genotype in the same organ/treatment) in the leaves, as estimated by goseq at an FDR cut-off of 0.05. Reciprocal of enrichment p-values are shown on the X axis. Red boxes indicate Biological Process GO terms; blue boxes indicate Molecular Function GO terms; green boxes indicate Cell Compartment GO terms. a Eurosis 3 h; b Eurosis 24 h; c Loto 3 h; d Loto 24 h
