Fig. 3.

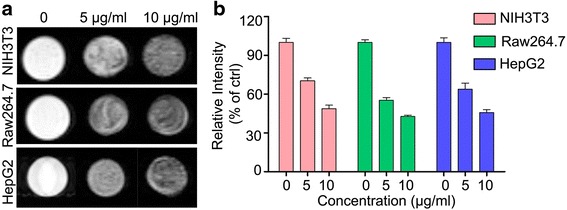
Cellular MRI performance of the SPIO nanoclusters as a contrast agent. a T 2 relativity images for the SPIO nanoclusters labeling NIH3T3, Raw264.7, and HepG2 cells. b Relative intensity of MRI images for these three cell labeling

Cellular MRI performance of the SPIO nanoclusters as a contrast agent. a T 2 relativity images for the SPIO nanoclusters labeling NIH3T3, Raw264.7, and HepG2 cells. b Relative intensity of MRI images for these three cell labeling