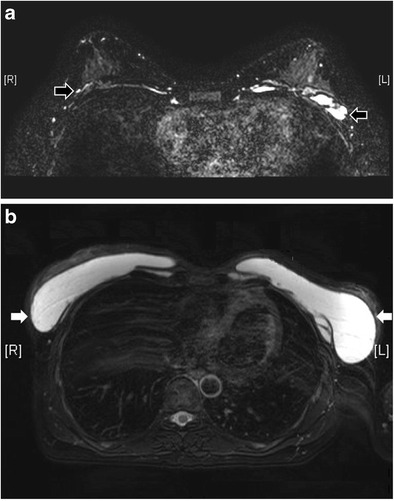
Fig. 20.

PAAG at anterior abdominal wall. Axial T2-weighted fat-suppressed image show there is minimal PAAG in bilateral retroglandular spaces (black arrows) (a). Instead, the main collections are found over anterior abdominal wall (white arrows) (b)
