
FIGURE 4.
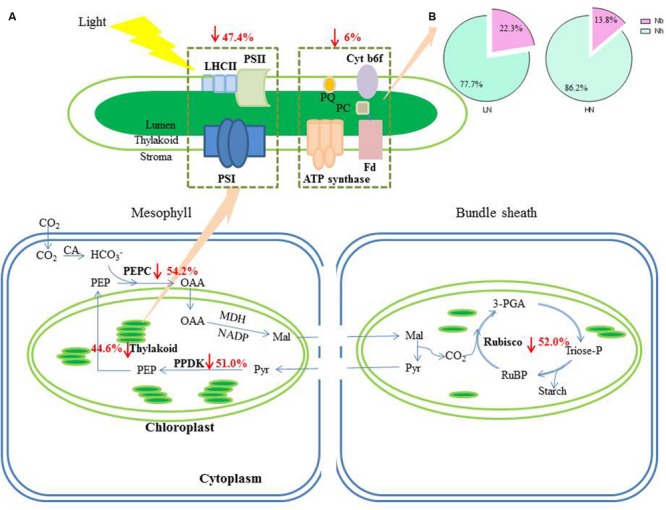
The change of N contents in photosynthetic apparatus caused by LN treatment. (A) The percentage together with the arrows indicate the reduction of N in different photosynthetic apparatus under LN compared to HN treatment. (B) The allocation of N between Nh and Nb within the thylakoid under LN and HN treatment. Abbreviations were listed in Table 1.