
FIGURE 5.
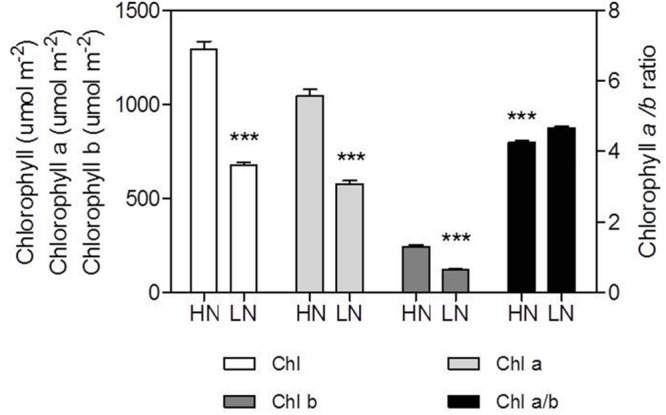
Effect of nitrogen (N) supply on the content of chlorophyll (Chl), Chl a, Chl b, and Chl a/b ratio of ear-leaf in maize. Bars denote the SE of the mean. ns, not significant (P > 0.05); ∗P < 0.05, ∗∗P < 0.01, ∗∗∗P < 0.001, respectively. HN corresponds to a N application of 180 kg ha-1; LN indicates that no N was applied.