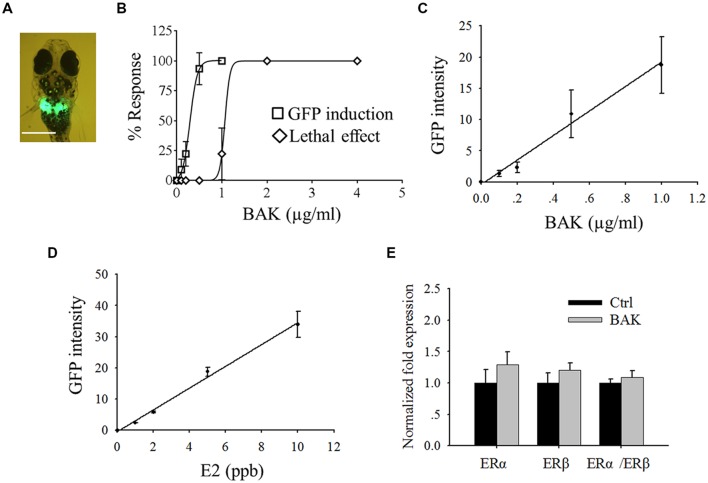
FIGURE 2.
Screening of in vivo estrogenic activity with transgenic medaka. (A) Bakuchiol induced GFP expression in liver, the white bar indicates 100 μm. (B) LC50 and EC50 of fish after exposure to bakuchiol for 24 h. Correlation between different concentrations of (C) bakuchiol and (D) E2, and the induced GFP signal intensity. (E) Analysis of mRNA expression of ERα and ERβ by using real-time PCR. Fish (n = 10) were exposed to 0.5 μg/ml bakuchiol for 24 h. 18S rRNA was used as the internal reference. BAK, bakuchiol.

