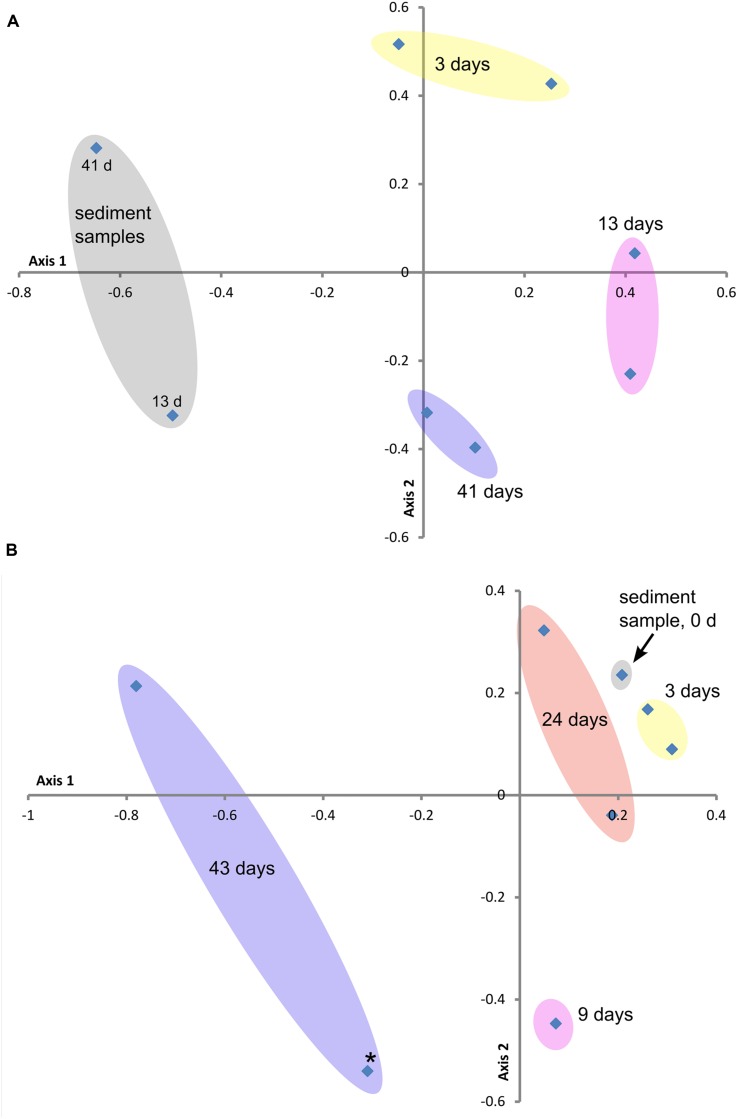
FIGURE 3.
Beta diversity ordination plots of sample communities from the two study sites: (A) GSB site and (B) BBH site. These non-metric multidimensional scaling plots (NMDS) are based on the Yue and Clayton Theta measure of dissimilarity values (distance matrix calculated at the 3% level), which assesses structural differences between the sample communities. Stress and R2 values for these ordination plots were (A) 0.20 and 0.76 and (B) 0.09 and 0.97, respectively. Colored ovals encompass replicate samples where applicable. Point marked with star (∗) in plot (B) represents outlier sample from Table 3.

