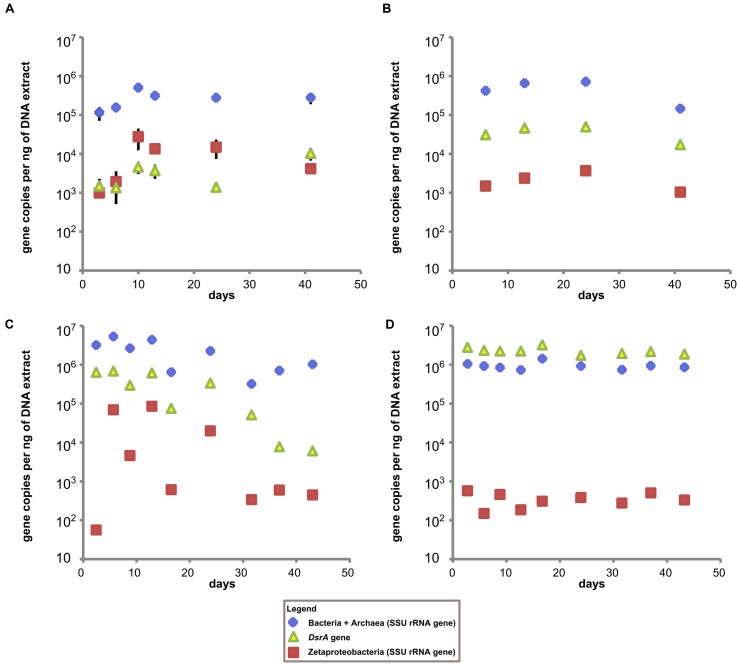
FIGURE 4.
Time series qPCR results. (A) Results from GSB site duplicate steel coupon extracts, (B) results from single stream sediment samples taken from sediment adjacent to the GSB site sampler, (C) results from BBH site triplicate steel coupon extracts, and (D) results from single sediment samples taken adjacent to the BBH site sampler. All data is gene copies per ng of DNA in extract. Error bars represent standard error of replicate samples where applicable; if not visible they fall within the boundaries of the symbol.

