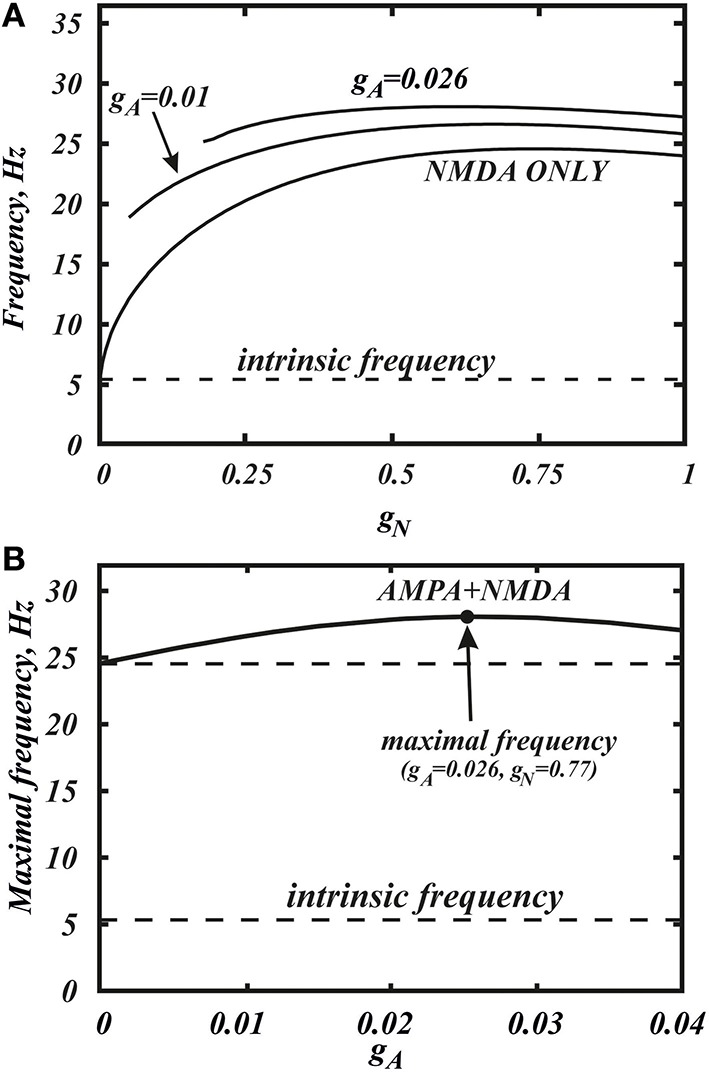
Figure 2.

Co-activation of AMPA and NMDA receptor currents allow one to reach a significantly higher frequencies. (A) Dependence of the frequency in the minimal model (Equation 1) on the conductance of NMDA current gN for the different values of gA. The curves correspond to horizontal slices of the Figure 4. (B) The maximum frequency calculated over the whole range of gN for each value of gA. The additional frequency growth exceeds 20%. The intrinsic frequency in the graph corresponds to the tonic firing without any external stimulus.
