
Figure 3.
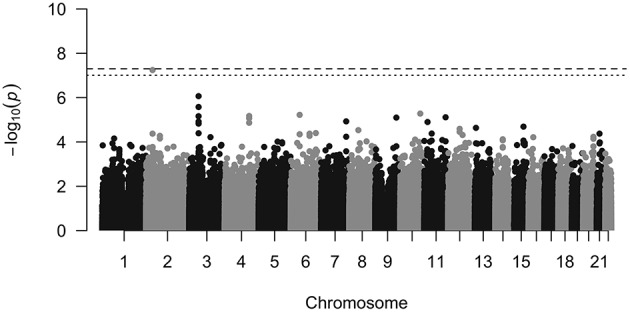
Manhattan plot. The dashed line shows genome wide significance threshold and the dotted line shows Bonferroni threshold for this study. The rs11691187 passed Bonferroni threshold and is near genome-wide significance threshold. It passed genome-wide significance threshold after combining with replication dataset (P = 2.40e-08).