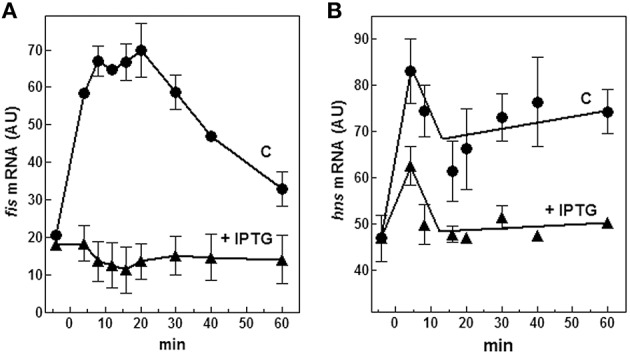
Figure 7.

Effect of (p)ppGpp on fis and hns expression. Levels of fis (A) and hns (B) mRNAs were estimated by Northern blotting analysis of total RNA extracted from E. coli cells growing at 37°C and carrying the plasmid pTK31. Cells were collected in stationary phase (time zero) and at the indicated times after dilution with fresh medium. As described in Figure 6A, the control culture was grown in the absence of IPTG (▴) whereas the induced culture contained 400 μM IPTG (●) to activate the lacUV5::relA gene. Data represent the average of at least two independent experiments and standard deviation is indicated.
