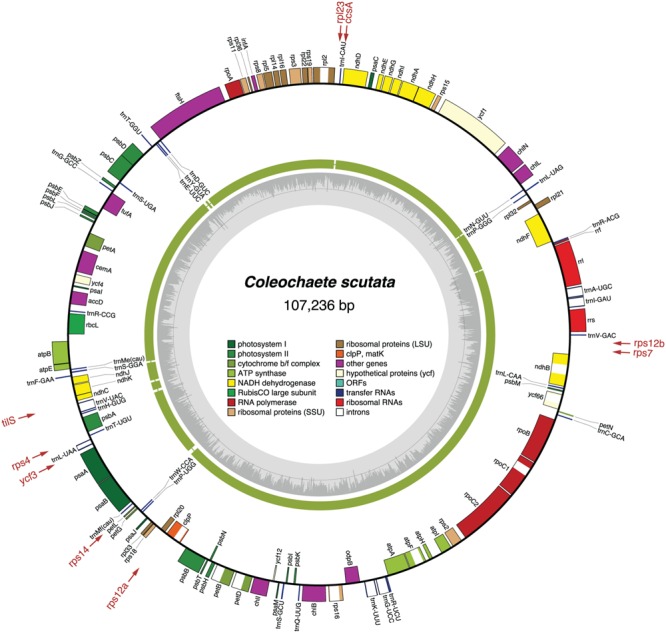
FIGURE 2.

Gene map of the Coleochaete chloroplast genome. Filled boxes represent genes, with colors denoting gene categories as indicated in the legend. Genes on the outside of each map are transcribed counterclockwise; those on the inside are transcribed clockwise. The green thick lines in the second outermost middle ring represent the gene clusters conserved between the Coleochaete and Chaetosphaeridium cpDNAs. The genes shown in red are present in Chaetosphaeridium but are missing in Coleochaete; the arrows associated with these genes point to the cpDNA regions where they are located in Chaetosphaeridium. The gray histogram on the inside of each map represents the G + C percentages calculated with OGDRAW (light gray, A + T; dark gray, G + C).
