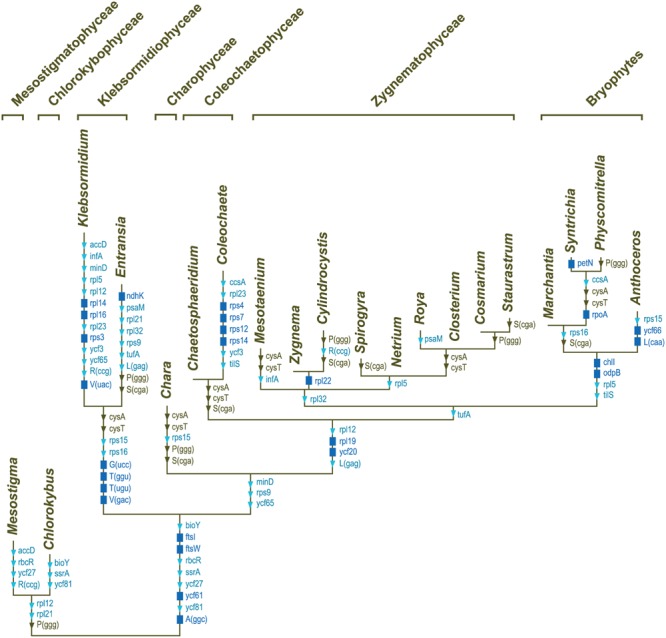
FIGURE 7.

Mapping of gene losses on the streptophyte phylogeny inferred in this study. Of the 144 genes that were present in the common ancestor of the 20 compared streptophytes, 90 were retained in all taxa: atpA, B, E, F, H, I, cemA, chlB, L, N, clpP, ftsH, ndhA, B, C, D, E, F, G. H, I, J, petA, B, D, G, L, psaA, B, C, I, J, psbA, B, C, D, E, F, H, I, J, K, L, M, N, T, Z, rbcL, rpl2, 20, 33, 36, rpoB, C1, C2, rps2, 8, 11, 18, 19, rrf, rrl, rrs, ycf1, 4, 12, trnA(ugc), C(gca), D(guc), E(uuc), F(gaa), G(gcc), H(gug), I(cau), I(gau), K(uuu), L(uaa), L(uag), Me(cau), Mf(cau), N(guu), P(ugg), Q(uug), R(acg), R(ucu), S(gcu), S(gga), S(uga), W(cca), Y(gua). The genes denoted by the dark blue rectangles represent synapomorphic losses, while the genes denoted by the triangles indicate homoplasic losses (light blue symbols, ≤3 independent losses; brown symbols, more than three independent losses).
