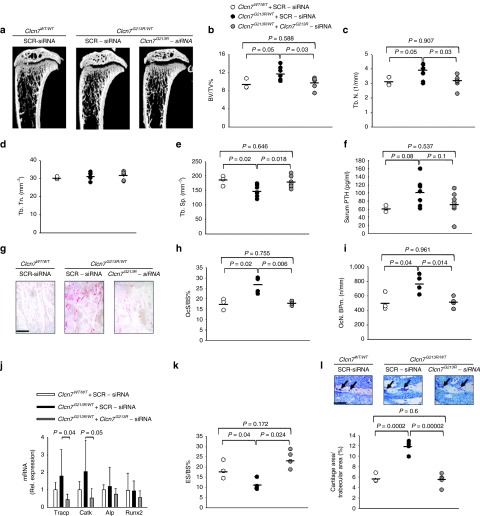
Figure 3.
Rescue of the bone phenotype. Ten-day-old Clcn7WT/WT and Clcn7G213R/WT were treated with 4 mg/kg of scrambled- (SRC) or Clcn7G213R-sticky siRNA jetPEI conjugate, three times a week for 4 weeks. At the end of the experiments, mice were sacrificed and their bone phenotype analyzed. (a) µCT analysis of proximal tibias. (b) Trabecular bone volume over total tissue volume (BV/TV). (c) Trabecular number (Tb.N). (d) Trabecular thickness (Tb.Th). (e) Trabecular separation (TB.Sp). (f) Serum concentration of ParaThyroid Hormone (PTH). (g) Histochemical TRAcP staining to evaluate osteoclasts (purple cells). Bar = 100 µm. (h) Osteoclast surface over bone surface (Oc.S/BS). (i) Osteoclast number over bone perimeter (Oc.N/B Pm). (j) Transcriptional expression, by real-time RT-PCR on RNA extracted from the whole femurs of osteoclast (Tracp and Cathepsin K (CatK)) and osteoblast (Alkaline phosphatase (ALP) and Runt-related transcription factor 2 (Runx 2)) genes normalized with gapdh. (k) Eroded surface over bone surface (ES/BS). (l) Representative images of the secondary spongiosa (upper panels) and measurement of cartilage area/trabecular area (lower panel). Arrows: cartilage remnants. Bar = 50 µm. Results are (a,g,i (upper panels)) representative or (b–f,h–i (lower panel)) the mean ± SD of three to seven mice/group (Student's t-test). In d, P > 0.2. For b–f,h–l statistics was also performed by one-way analysis of variance (shown in Supplementary Table S3).

