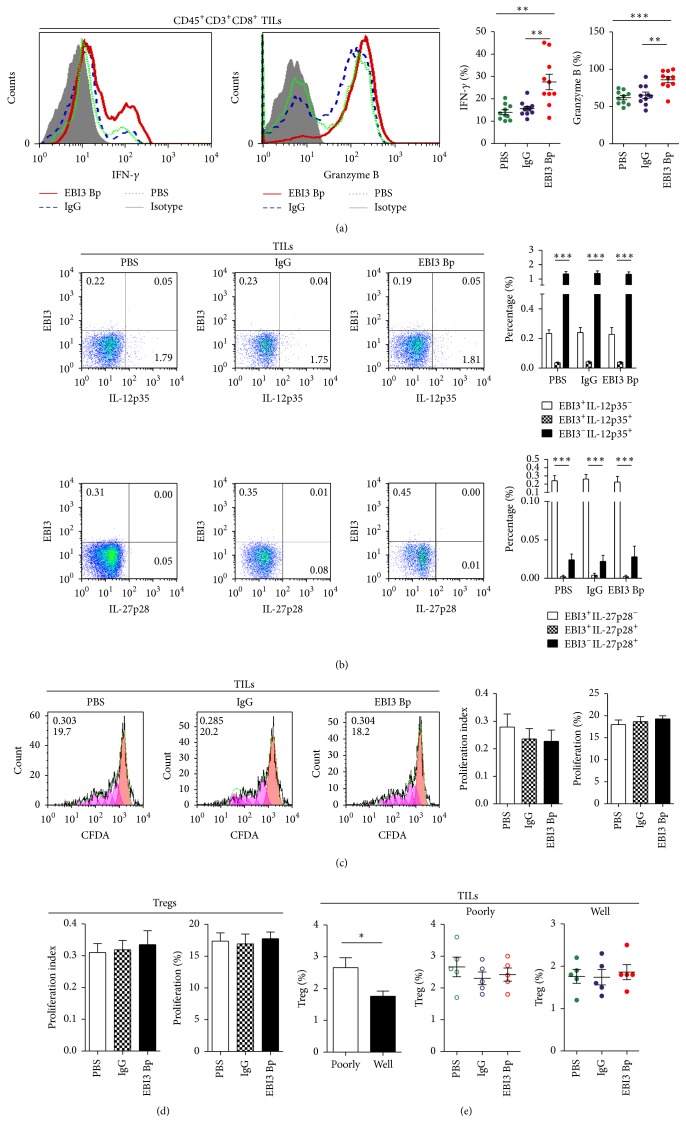
Figure 3.
Assessing the role of EBI3 blocking in antitumor CTL response by flow cytometry. (a) Representative images for the Granzyme B and IFN-γ production on CD45+CD3+CD8+ TILs after being cocultured with CRC cells stimulated with EBI3 Bp for 3 days, an isotype IgG, and PBS for control. Scatter plot graph showing the percentage of Granzyme B and IFN-γ production on CD45+CD3+CD8+ TILs. (b) Representative images for EBI3, IL-27p28, and IL-12p35 expression on CD45+CD3+ TILs after being cocultured with CRC cells stimulated with EBI3 Bp, IgG, and PBS by flow cytometry. (c) Representative images for CD45+CD3+CD8+ TILs cell proliferation after being cocultured with CRC cells stimulated with EBI3 Bp, IgG, and PBS were detected by CFDA assay. The value (inside) for the percentage of cells that divided at least once (top left corner) and the average number of cell divisions (bottom left corner) are indicated for each groups. (d) Treg cell proliferation after being cocultured with CRC cells stimulated with EBI3 Bp, IgG, and PBS was detected by CFDA assay. (e) Treg cell content in TILs from poorly and well differentiated tumor tissues was detected by FCM after being cocultured with CRC cells stimulated with EBI3 Bp, IgG, and PBS. ∗ P < 0.05; ∗∗ P < 0.01; ∗∗∗ P < 0.001.

