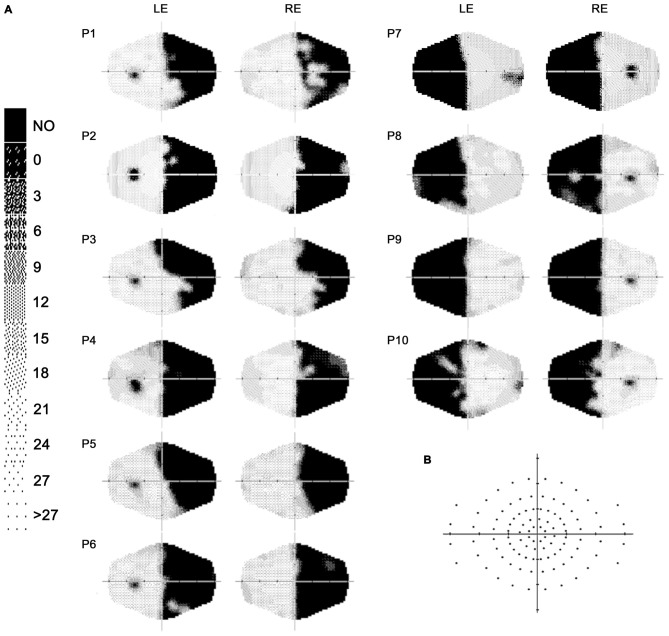
Figure 1.
(A) Computerized automated visual perimetry (Medmont M700 automated perimetry apparatus, Melbourne, Australia). Axial hash marks denote 10 visual degree increments; color map reports decibel values; LE = left eye, RE = right eye. (B) Schematic view of the visual field maps, depicting the locations of visual stimulation.

