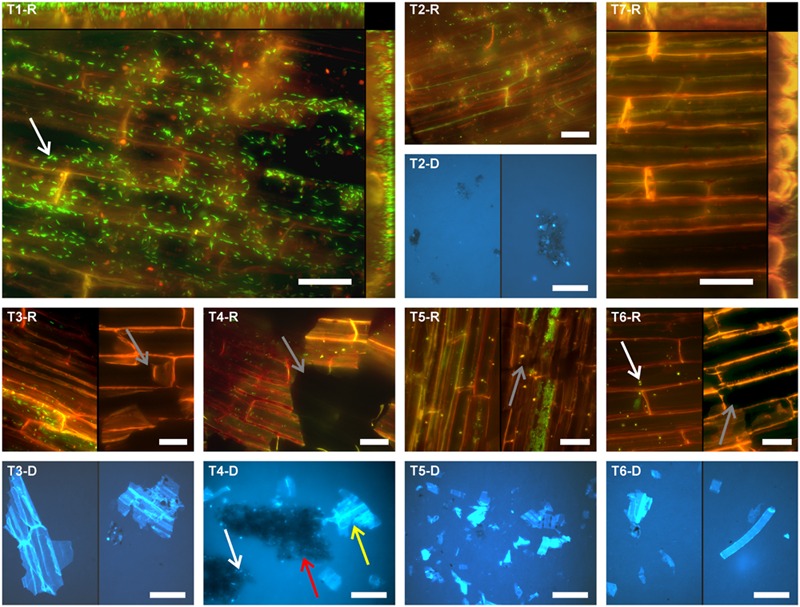
FIGURE 1.

Fluorescence micrographs showing the microbial colonization of differently treated rice root surfaces. T1: untreated, T2: washed, T3: sonication probe (low intensity), T4: sonication probe (high intensity), T5: sonication bath (low intensity), T6: sonication bath (high intensity), T7: treated with NaOCl. For T2–T6 respective fluorescence micrographs of the detached cells and root fragments are presented (#-D). Microorganisms can be observed in green fluorescence (SYBR-Green I stain) in rhizoplane images (#-R) and bright blue fluorescence (DAPI stain) in the micrographs showing detached microbial cells (#-D), respectively. Scale bar represents 20 μm in rhizoplane images (#-R) and 50 μm in images of samples with detached material (#-D). T1-R and T7-R show merged z-profiles along both edges of the respective images. Arrows exemplarily indicate microbial cells (white), root tissue disruption (gray), soil particles (red), and root fragments (yellow).
