
FIGURE 2.
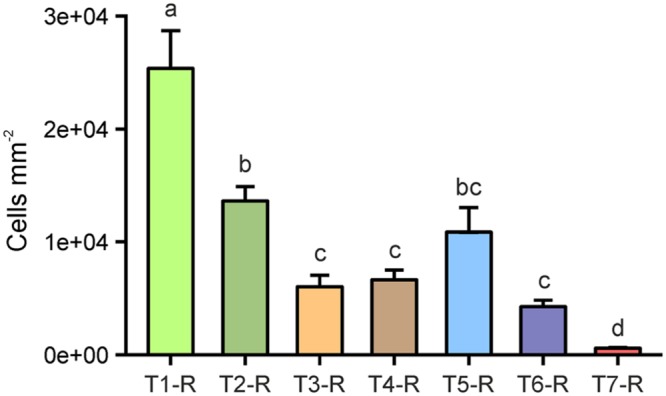
Microbial cells enumerated on rice root surfaces (#-R) after the application of separation treatments. T1: untreated, T2: washed, T3: sonication probe (low intensity), T4: sonication probe (high intensity), T5: sonication bath (low intensity), T6: sonication bath (high intensity), T7: treated with NaOCl. Letters indicate significant differences (p < 0.05); error bars: standard error (n = 3).