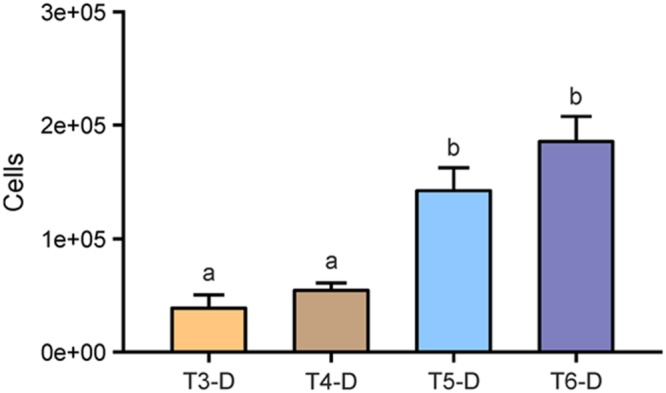
FIGURE 3.

Detached microbial cells enumerated in suspensions (#-D) after sonication treatments. T3: sonication probe (low intensity), T4: sonication probe (high intensity), T5: sonication bath (low intensity), T6: sonication bath (high intensity). All roots have previously been subjected to washing (T2) resulting in 5.23 × 10⁴ (±1.20 × 10⁴ SE) cells detached per root segment. Letters indicate significant differences (p < 0.05); error bars: standard error (n = 3).
