
FIGURE 5. Autopatcher software graphical user interface (GUI).
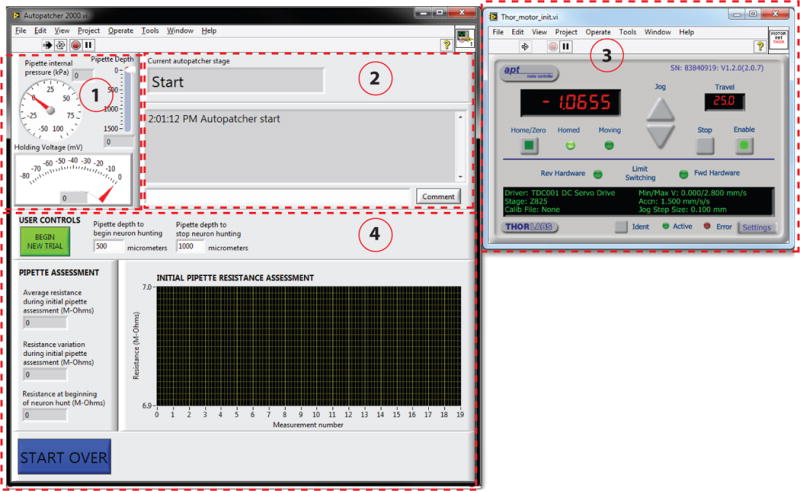
Red dotted lines outline different panels of the GUI. Panel (1): Pipette status indicators that display the instantaneous pipette position (in μm) from surface of the brain, pressure applied to the pipette (in kPa), and the holding voltage (in mV) applied to the pipette during autopatcher operation. Panel (2): Text indicators that display the current status of the autopatcher trial, and a log of all autopatching trials attempted during an experiment, as well as an entry box where the experimenter can log comments. Panel (3): Includes control elements that allow the experimenter to control the programmable motor. This displays the absolute position of the pipette in motor coordinates. Panel (4): The interactive elements displayed in this panel depend on the stage of autopatching, and include methods for setting the beginning and ending depth ranges within which the autopatcher will scan for neurons, amongst other things (see Figs. 6 and 7 and Supplementary Video 1 to see how this box changes throughout the protocol).