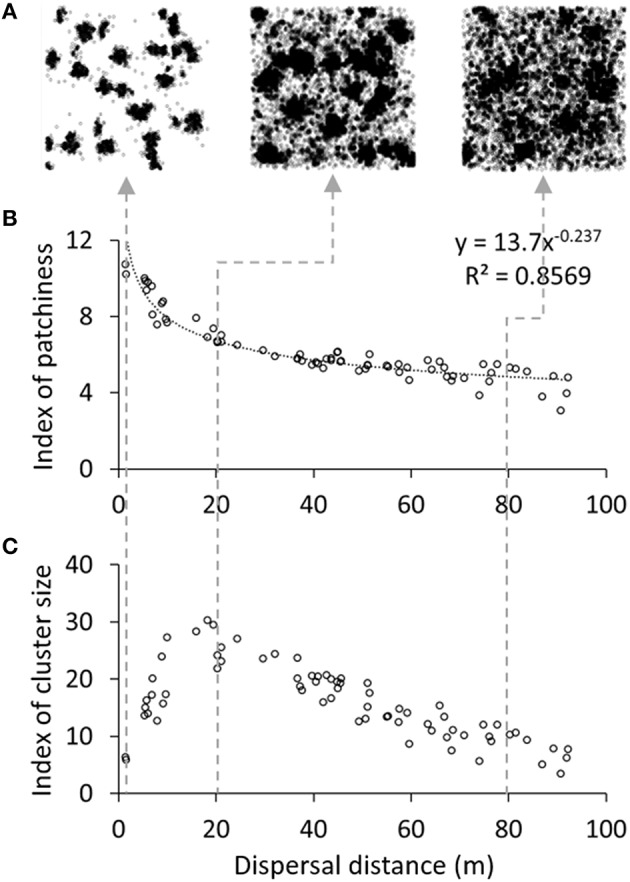
Figure 4.

Influence of dispersal distance on vegetation patterns. The top panel (A) illustrates typical spatial distributions at the end of simulations with 1, 20, and 80 m mean dispersal distance (from left to right). Each plot represents the effect of dispersal distance on (B) the index of patchiness and (C) the index of cluster size. At initialization, 250 plants were grouped in 25 patches on a 200 × 200 m plot and the experiment was run over 5 years (Default parameter values).
