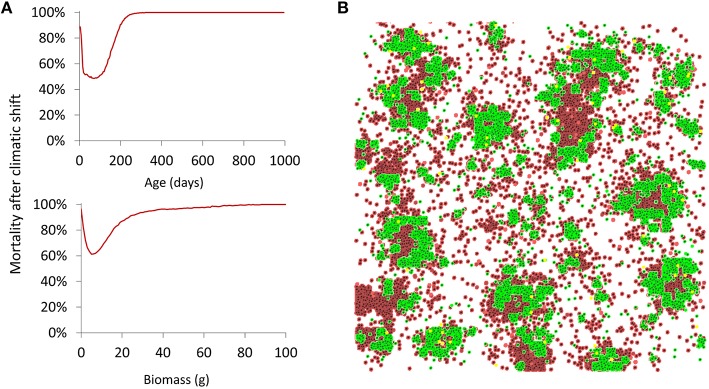
Figure 5.
Effect of a shift in precipitation regime (1.3 –> 0.8 mm) on vegetation. (A) Plant mortality depending on age and biomass averaged over 100 replicated runs. (B) Example of a simulated plot (200 × 200 m) right after the precipitation regime shift. The plot shows surviving individuals (green) and the death (red) of old individuals in the central areas of the patches and young isolated individuals (Default parameter values).

