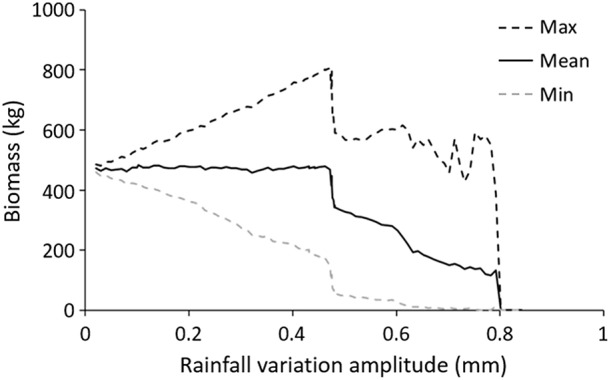
Figure 6.

Effect of seasonal variations in precipitation. The mean (continuous line), maximum (black dashed line) and minimum (gray dashed line) value of the total population biomass were computed based on the last 4 years of each 12-year simulation run. The simulations were carried out with changing amplitude of the seasonal rainfall regime (mean rainfall 1.3 mm ± amplitude). At initialization, 250 plants were grouped in 25 patches on a 200 × 200 m space (Default parameter values).
