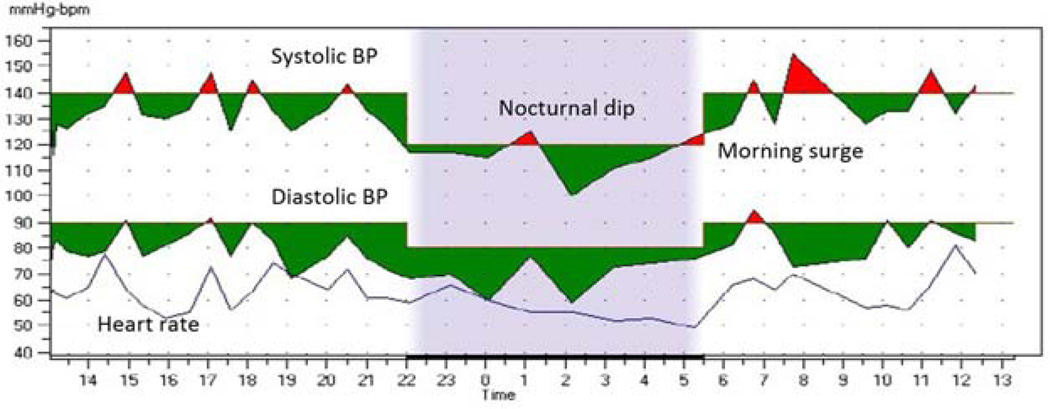
FIGURE. Graph of 24-Hour Ambulatory Blood Pressure Monitoring Data.
The shaded portion indicates the sleep period. This patient had 8 measurements recorded during sleep and 29 measurements while awake. The overall average is 130/79 mm Hg. Awake average is 134/82 mm Hg, and sleep average is 115/70 mm Hg, for a nocturnal systolic BP dip of 14%.

