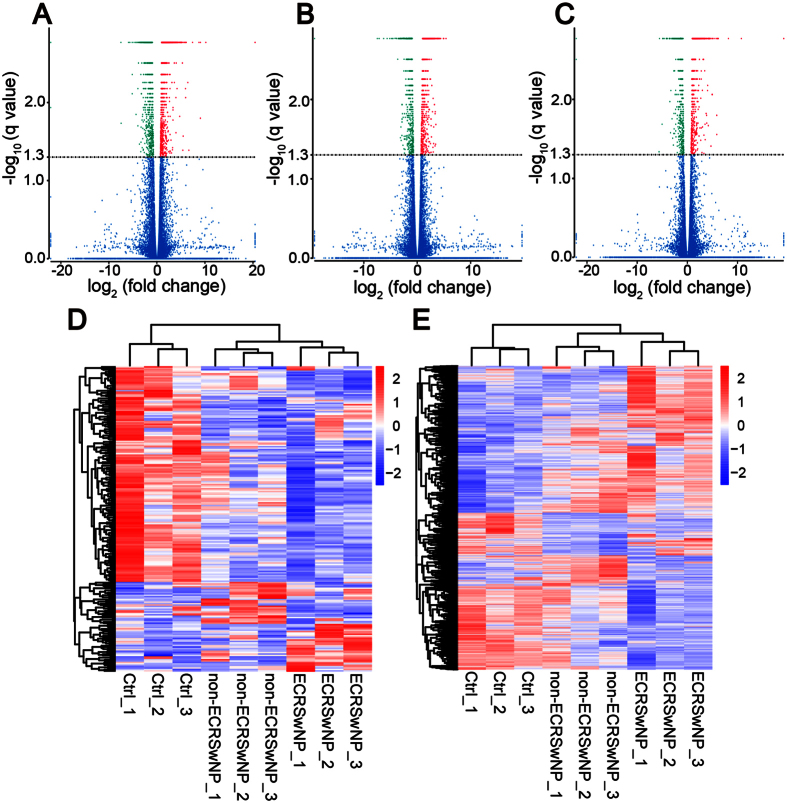
Figure 3. Transcriptome profile of RNA-Seq data distinguishing three groups.
(A) A volcano plot of differentially expressed transcripts (lncRNAs and mRNAs) between ECRSwNP and control group, and (B) between non-ECRSwNP and control group, and (C) between ECRSwNP and non-ECRSwNP group, respectively. (D–E) Unsupervised hierarchical clustering of the expression profiles of differentially expressed lncRNAs (D) and mRNA (E) both distinguish ECRSwNP, non-ECRSwNP and control group.

