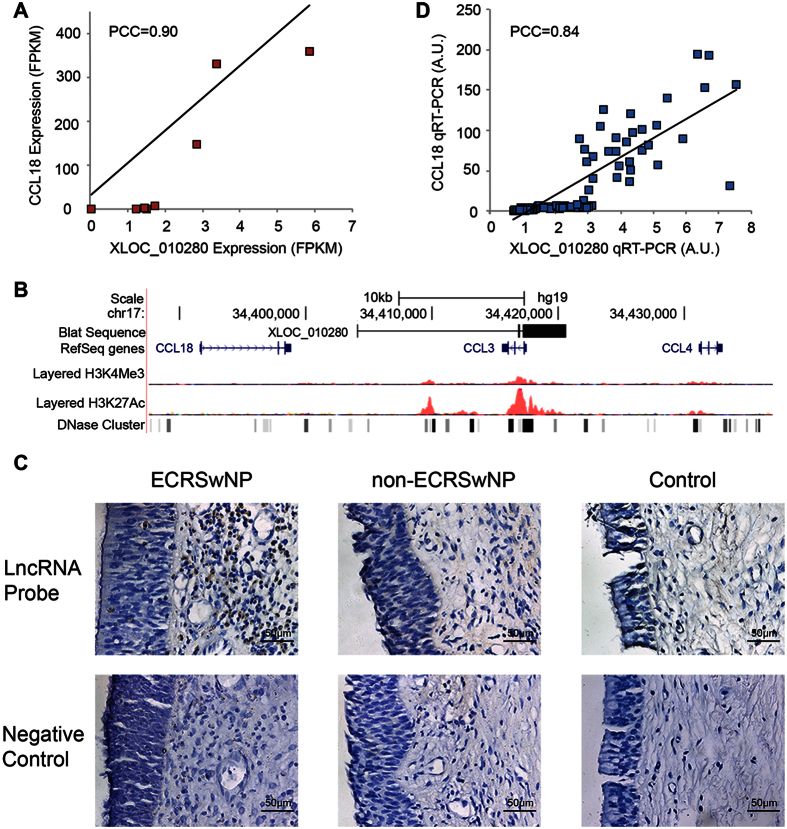
Figure 7. Significant correlation between lncRNA XLOC_010280 and CCL18.
(A) A scatterplot of XLOC_010280 and CCL18 expression levels in individual nasal samples determined by RNA-Seq. (B) The genomic location of XLOC_010280 and CCL18 shown by UCSC genome browser. (C) The specific up-regulation of XLOC_010280 in ECRSwNP compared with non-ECRSwNP and control detected by in situ hybridization. Representative of 5 donors per group shown as original magnification 200×. (D) A scatterplot of XLOC_010280 and CCL18 expression levels in individual nasal samples determined by qRT-PCT.

