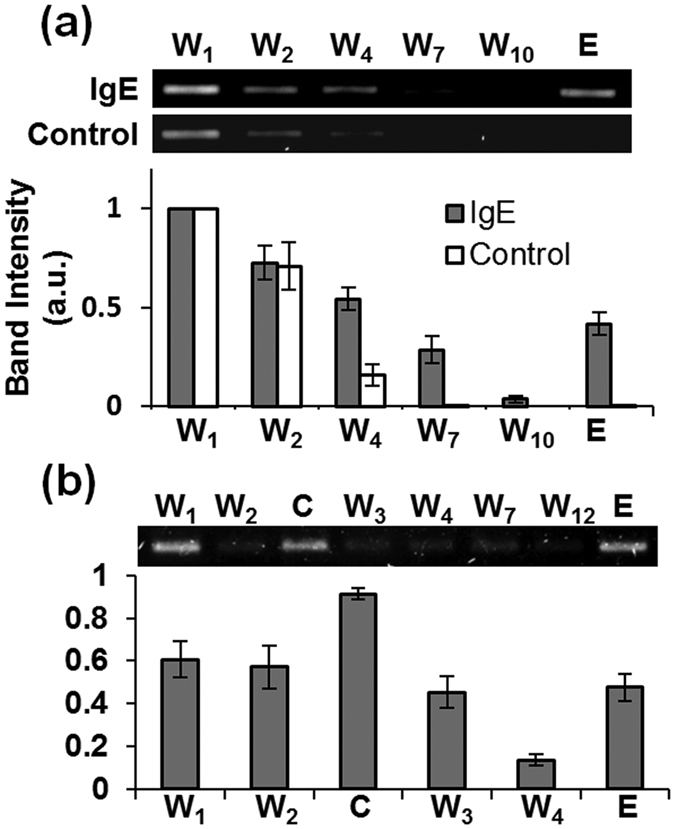
Figure 2. Microfluidic affinity selection of target-binding oligonucleotides.

Bar graphs and representative gel images depict the relative band intensity in the gel image (inset) of eluate obtained during affinity selection for (a) IgE and (b) BA-glucose mixture. As control, bare beads were used for the affinity selection experiments for IgE. Bisboronic acid was used as a counter target for isolating aptamers targeting the BA-glucose mixture. Lane W: wash; Lane E: elution; Lane C: counter selection. All experiments were repeated three or more times (Supplementary Information, Figures S11, S12 and S13) with standard errors indicated with error bars.
