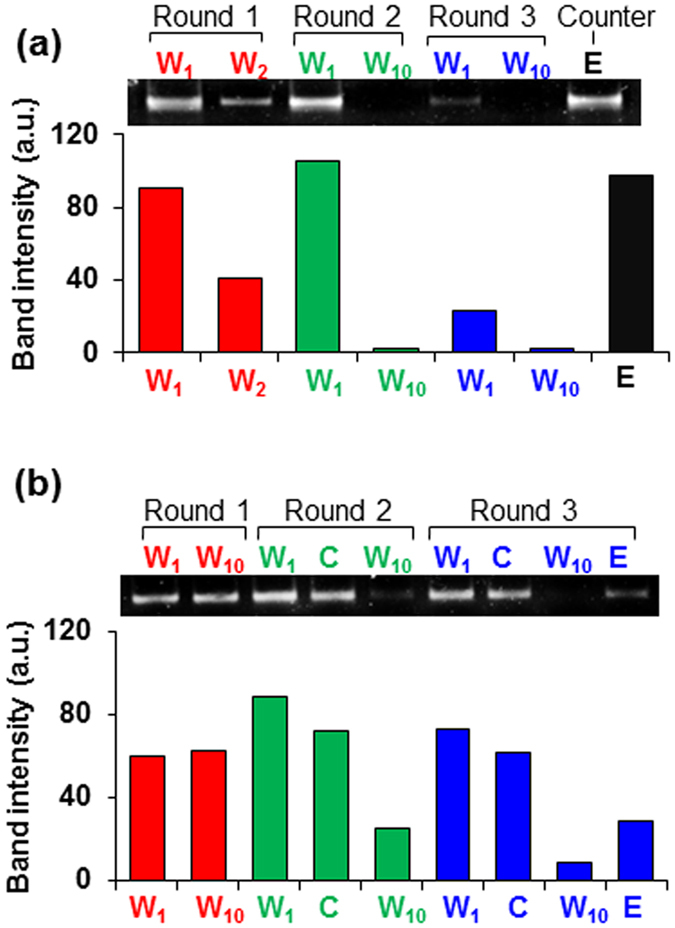
Figure 4. Gel electropherograms showing progress in the isolation of target-binding aptamer candidates during multi-round microfluidic SELEX.

Bar graphs depict the band intensity in the gel images from eluents collected during the SELEX process for (a) IgE and (b) BA-glucose mixture. Lane W: wash; Lane C: counter selection; Lane E: elution.
