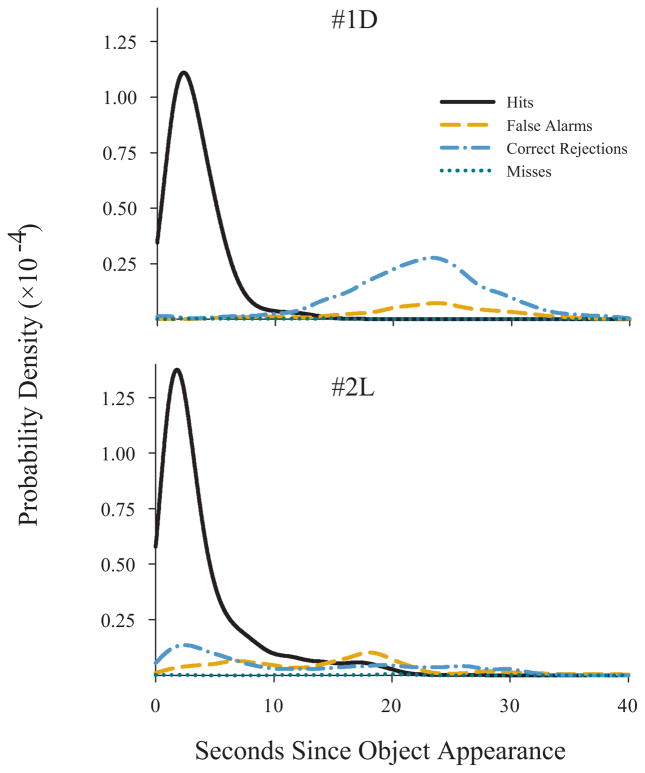
Fig. 3.
Probability distributions for pecks after object appearance during the within-trial object phase of testing in Experiment 1. Note that the vertical scale represents probability density with respect to all conditions, so the relative areas of the distributions reflect the relative frequency of hits, misses, false alarms, and correct rejections as well as the time that the peck was emitted. All pecks were included, not just pecks registered as being on the object in the display. The distributions were smoothed in R using a Gaussian smoothing kernel with a bandwidth of 1000 ms to generate data for 4096 points between 0 and 40 s.

