
Figure 3. Comparison of averaged stress-strain curves for the four geometries.
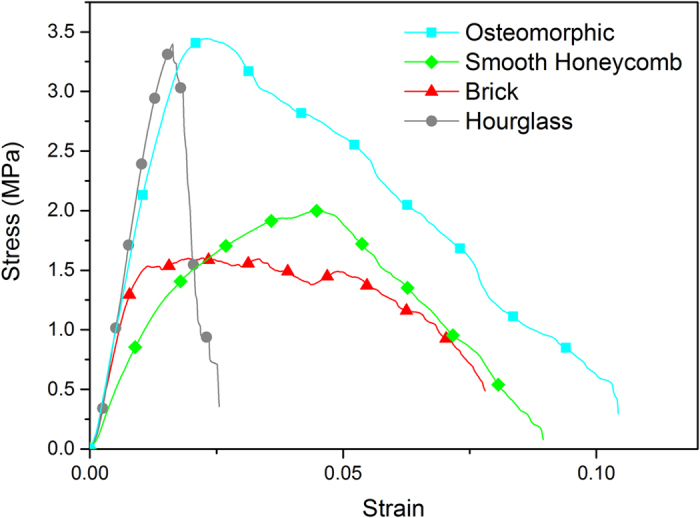
This plot illustrates the increase in peak stress, strain at failure, and modulus of toughness of the osteomorphic specimen as compared to the brick-and-mortar structure. The effect of the high peak load appears to be associated with interlocking, as it is the greatest for the “hourglass” and the “osteomorphic” cases – both involving interlocking.