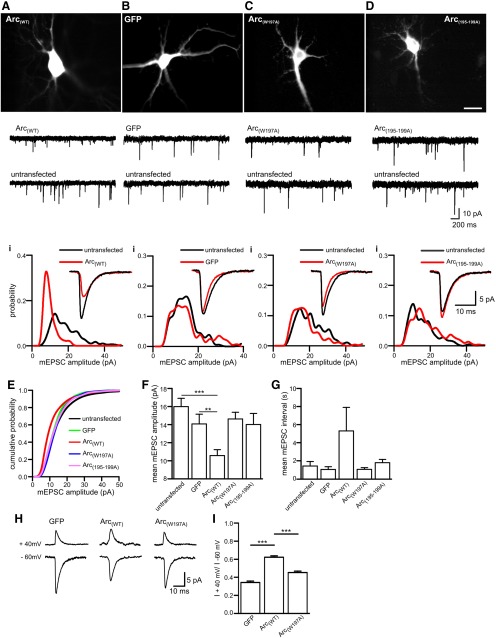
Figure 4.
The Arc–AP-2 interaction regulates AMPAR-mediated synaptic currents. A–D, Representative live imaging of a dissociated hippocampal neuron overexpressing Arc-GFP-tagged constructs and GFP. A, AMPAR-mediated mEPSC traces from a neuron overexpressing Arc(WT) and an untransfected neighboring neuron. Ai, Amplitude probability distribution for the mEPSCs shown in A. Note the shift to the left and increase in the amplitude of the main peak in the neuron overexpressing Arc(WT), clearly demonstrating the reduction in mEPSC amplitude. Inset, Superimposed average mEPSC waveforms. B, Representative AMPAR-mediated mEPSC traces from a neuron overexpressing GFP and an untransfected neighboring neuron. Bi, Amplitude probability distributions for mEPSCs recorded from the neurons shown in B. Inset, Superimposed average mEPSC waveforms. C, Representative AMPAR-mediated mEPSC traces from a neuron expressing Arc(W197A) and an untransfected neighboring neuron. Ci, Amplitude probability distributions from neurons shown in C. Note that expression of Arc(W197A) produced a smaller reduction in mEPSC amplitude compared with Arc(WT) overexpression. Inset, Superimposed average mEPSC waveforms. D, Representative AMPAR-mediated mEPSC traces from a neuron expressing Arc(195-199A) and an untransfected neighboring neuron. Di, Amplitude probability distributions from neurons shown in d. Note that expression of Arc(195-199A), in which the sequence 195QSWGP199 of Arc was mutated to 195AAAAA199 had little effect on mEPSC amplitude. Inset, Superimposed average mEPSC waveforms. E, Cumulative probability distributions for cells expressing Arc(WT) (12 neurons), Arc(W197A) (13 neurons), Arc(195-199A) (10 neurons), GFP (7 neurons), and for untransfected cells (20 neurons). F, Bar chart plotting mean mEPSC amplitude for the cells in E. Expression of Arc(WT) significantly reduced mEPSC amplitude (mean reduced from 15.99 ± 0.9 pA in untransfected cells to 10.56 ± 0.66 pA, p= 0.0002), whereas expression of Arc(W197A) or Arc(195-199A) had no significant effect (14.6 ± 0.74 pA, p=0.12 and 14.01 ± 1.2 pA, p= 0.37). Expression of eGFP had no significant effect (p=0.376) on the mean mEPSC amplitude compared to untransfected cells. G, Bar chart plotting the mean interval between mEPSCs. Expression of Arc(WT) and the Arc mutants had no significant effect on the frequency of mEPSCs. Although the mean frequency of mEPSCs in cells expression Arc(WT) appeared reduced, this was not significant as there was large variability between cells. H, Representative average mEPSC waveforms recorded at a holding potential of −60 and + 40 mV for cells expressing GFP, Arc(WT), and Arc(W197A) in the presence of spermine (100 µm) in the intracellular solution. I, Bar chart plotting the mean rectification index (peak amplitude at +40 mV divided by peak amplitude at −60 mV) for neurons expressing GFP (n = 9 cells; 0.34 ± 0.015), Arc(WT) (n = 9 cells; 0.62 ± 0.016), and Arc(W197A) (n = 6 cells; 0.45 ± 0.015). Thus, Arc(WT) reduces the amount of rectification (as seen as an increase in the rectification index), whereas Arc(W197A) has significantly less effect on rectification. Error bars in F, G, and I are SEM. ***p<0.001, **p<0.01. Statistical significance was tested using the Mann–Whitney test. Scale bar, 10 µm.

