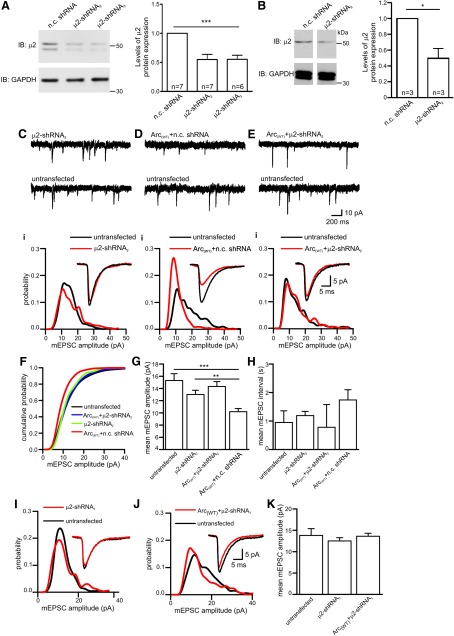
Figure 6.
AP-2 is required for Arc-dependent changes in synaptic strength. A, Blots showing levels of µ2 protein obtained from NSC cells overexpressing n.c. shRNA, µ2-shRNA2, µ2-shRNA3 plasmids for 3–4 d. GAPDH was used as loading control. Bar chart plotting the analysis of µ2 band intensity normalized by GAPDH. Error bars indicate ± SEM and significance was tested using one-way ANOVA. ***p=0.0001. B, Blots showing levels of µ2 protein obtained from cultured hippocampal neurons infected for 8–9 d with lentiviruses expressing either µ2-nc shRNA or µ2-shRNA2 sequences for 8–9 d. GAPDH was used as loading control. Bar chart plotting the analysis of µ2 band intensity normalized by GAPDH intensity. Error bars indicate ± SEM and significance was tested using one-way ANOVA. *p=0.019. C, Representative AMPAR-mediated mEPSC traces from a neuron expressing µ2-shRNA2 and an untransfected neighbor. Ci, Amplitude probability distributions from the neuron shown in C. Note that reduction of AP-2 expression (µ2-shRNA2) has little effect on mEPSC amplitude. Inset, superimposed average mEPSC waveforms. D, Representative AMPAR-mediated mEPSC traces from a neuron coexpressing Arc(WT) and nc shRNA and an untransfected neighbor. Di, Amplitude probability distribution from the neurons in D. Note that coexpression of a n.c. shRNA does not prevent overexpression of Arc from reducing mEPSC amplitude. Inset, Superimposed average mEPSC waveforms. E, Representative AMPAR-mediated mEPSC traces from a neuron coexpressing Arc(WT) and µ2-shRNA2 and an untransfected neighbor. Ei, Amplitude probability distribution from the neurons showed in E. Note that coexpression of µ2-shRNA2 prevents the effects of Arc(WT) on mEPSC amplitude. Inset, Superimposed average mEPSC waveforms. F, Cumulative probability distributions for cells expressing shRNA2 (9 neurons), Arc(WT) + shRNA2 (16 neurons), Arc(WT)+n.c shRNA (7 neurons), and for untransfected cells (12 neurons). G, Bar chart plotting mean mEPSC amplitude for the cells in f. Expression of shRNA2 prevented the Arc(WT) overexpression effect of significantly reducing mEPSC amplitude (mean mEPSC amplitude 15.3 ± 1 pA in untransfected cells, Arc(WT) + shRNA2 14.3 ± 0.8 pA; p=0.52). Expression of shRNA2 alone had no significant effect on mEPSC amplitude (13 ± 0.7 pA; p=0.07), whereas Arc(WT) + n.c. shRNA significantly reduced mEPSC amplitude (10.2 ± 0.53 pA; p=0.001). H, Bar chart plotting the mean interval between mEPSCs for the cells in F. The error bars in G and H are SEM. ***p<0.001, **p<0.005. Statistical significance was tested using the Mann–Whitney test. I, Amplitude probability distributions for a neuron expressing µ2-shRNA3 and an untransfected neighbor and for a neuron overexpressing Arc(WT) with µ2-shRNA3 and an untransfected neighbor (J). Inset, Superimposed average mEPSC waveforms. K, Bar chart of mean mEPSC amplitudes for untransfected cells (n = 8), cells transfected with μ2-shRNA3 (n=10) and cells transfected with Arc(WT)+ μ2-shRNA3 (n=6). Neither expression of μ2-shRNA3 or Arc(WT)+μ2-shRNA3 significantly changed mEPSC amplitude (p=0.68 and p=0.27, respectively).

