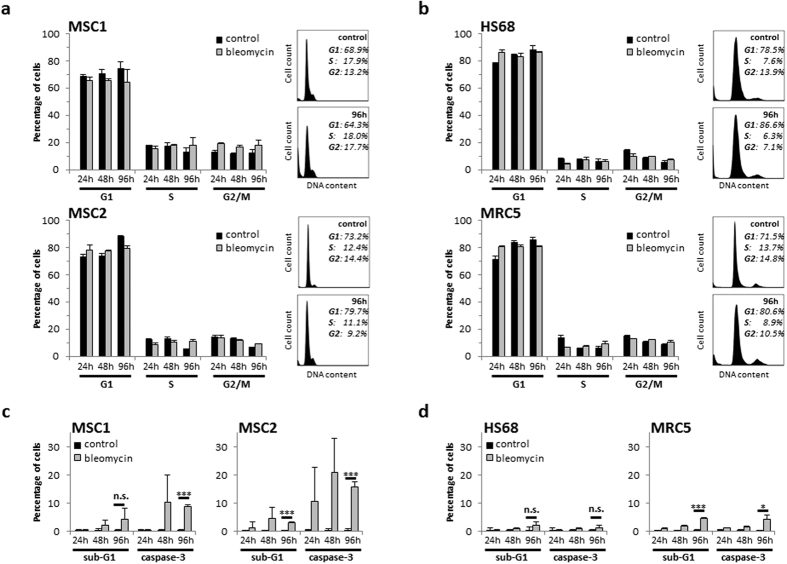
Figure 2. Bleomycin treatment results in increased apoptosis but no cell cycle changes in MSCs.
Cell cycle distribution of two MSC samples (a) and two adult fibroblast cell lines (b) after 4-hour exposure to 1800 ng/mL bleomycin. (c,d) Percentage of apoptotic MSCs and adult fibroblasts after treatment with 1800 ng/mL bleomycin as assessed by sub-G1 population and caspase-3 activation. Data are mean +/− SD (n = 3). *P < 0.05, ***P < 0.001.

