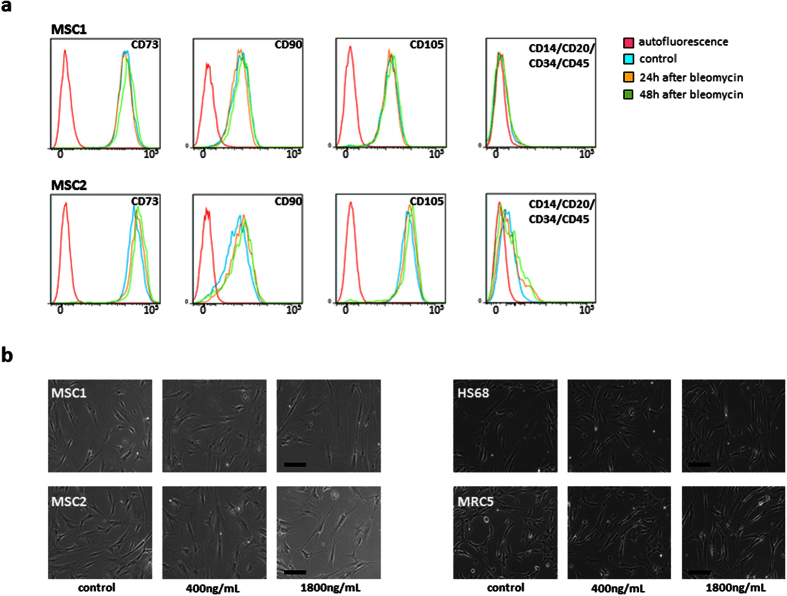
Figure 4. MSCs stably express defining surface markers after bleomycin treatment.
(a) Representative FACS analyses of defining positive MSC markers CD73, CD90 and CD105 and negative markers CD14, CD20, CD34 and CD45 at 24 and 48 hours after treatment with 1800 ng/mL bleomycin. (b) Representative microscopic images of unstained MSCs and adult fibroblasts showing no measurable changes in morphology after treatment with 400 or 1800 ng/mL bleomycin (20× objective, scale bar 100 μm).

