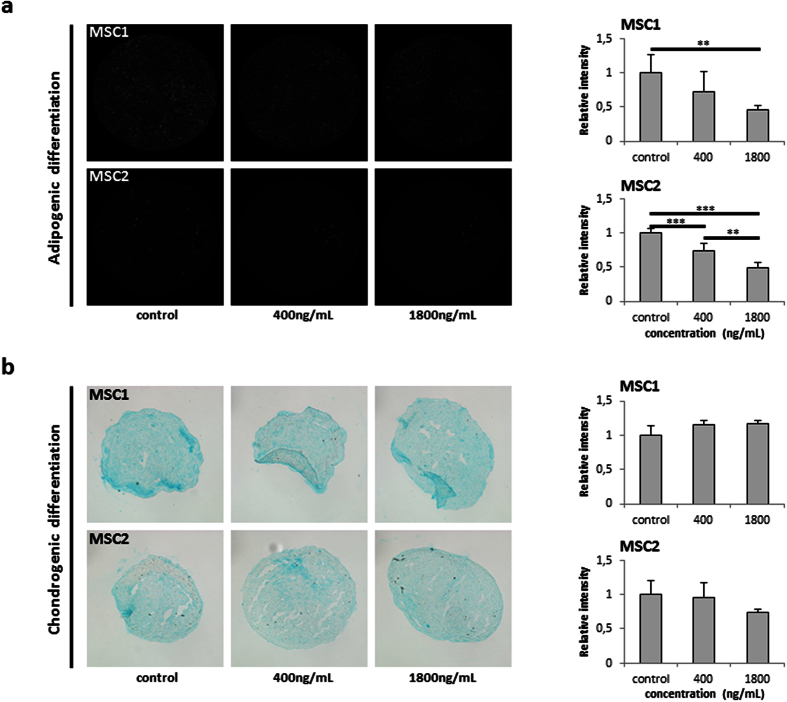
Figure 5. Bleomycin treatment reduces adipogenic but not chondrogenic differentiation potential of MSCs.
(a) Representative BODIPY lipid staining of MSC1 and MSC2 samples after 4-hour exposure to 400 and 1800 ng/mL bleomycin to assess adipogenic differentiation. (b) Representative Alcian blue staining for chondrogenic differentiation in MSC1 and MSC2 samples after bleomycin treatment. Relative staining intensities were measured to quantify differentiation levels after adipogenic and chondrogenic differentiation. Data are mean +/− SD. **P < 0.01, ***P < 0.001.

