
Fig. 9.
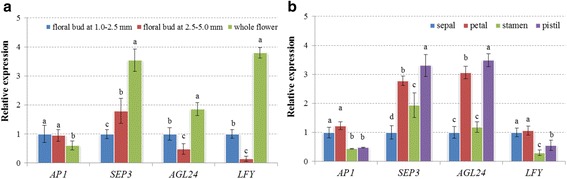
The spatial-temporal expression profiling of flower development-related genes by RT-qPCR analysis. a The relative expression levels of four genes at three stages of flower development. b The relative expression levels of four genes at different flower parts (sepal, petal, stamen and pistil). Each bar shows the mean ± SE of triplicate assays. The values with different letters indicate significant differences at P < 0.05 according to Duncan’s multiple range tests