
Fig. 1.
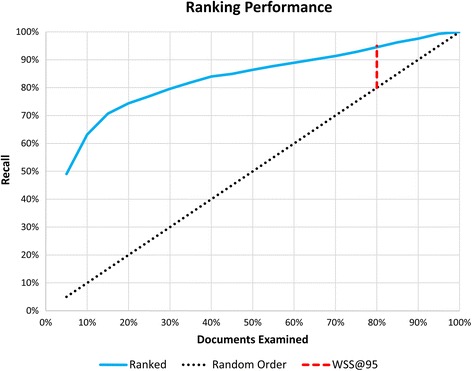
“Work Saved over Sampling” (WSS) performance metric. The dotted black line illustrates the expected recall achieved when traversing a randomly ordered list. Similarly, the blue line shows the recall obtained when traversing a (hypothetical) ranked list. The length of the dotted red line indicates the percent reduction in effort achieved by ranking and corresponds to the WSS at 95 % recall, in this case, approximately 15 % (95–80 %)