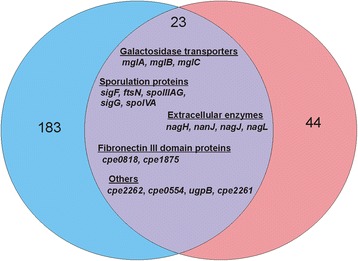
Fig. 4.

Genes that were regulated by both VirR and RevR. The Venn diagram generated with Vennt software represents the number of genes that were regulated by VirR (183; blue), RevR (44; pink) or both (23; purple). The 18 genes that were controlled by both regulators are indicated. The five genes that were regulated in a similar manner by VirR and RevR are not listed here
